



This section positions the PLC as a strategic lens rather than just an academic concept. The goal is to show why marketers, product managers, and founders should care about it.
The product life cycle models how a product’s sales, demand, and profitability change over time, from launch until the product is discontinued. Because each stage has different customer behavior, competition, and cost structures, your marketing, pricing, and product decisions should shift as the product progresses through the cycle.
What is the product life cycle?
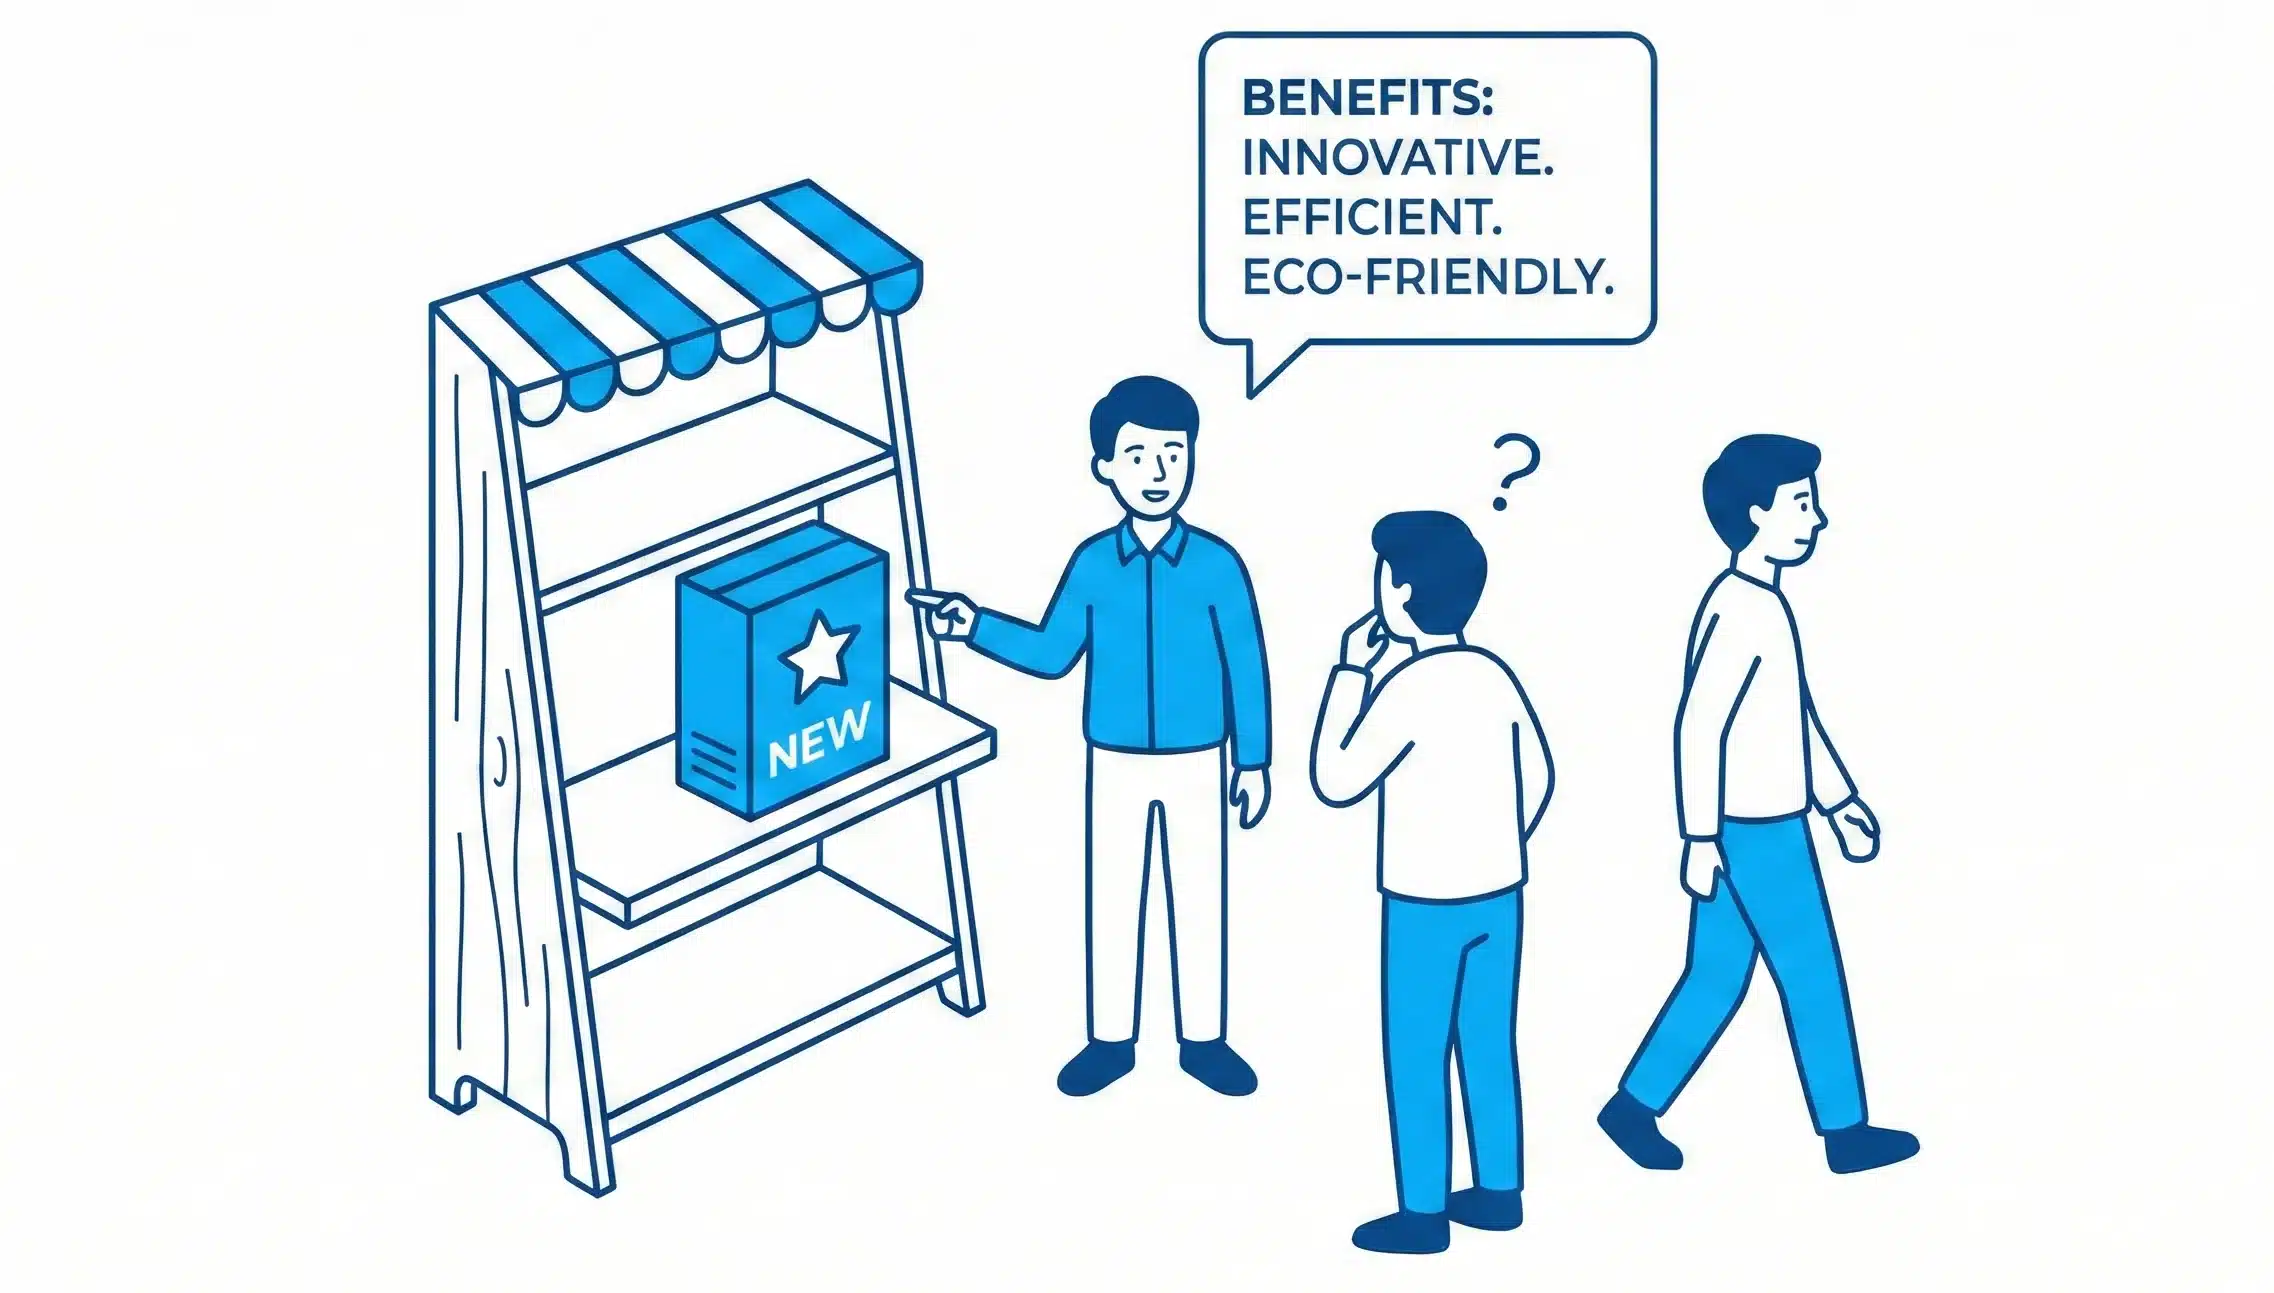
The product life cycle is the pattern a product typically follows in the market: it is introduced, grows, reaches maturity, and then declines as demand falls or alternatives replace it. The concept is widely used in marketing and product management to forecast performance, plan investments, and time product improvements or retirements.
Most classic PLC models use four stages:
- Introduction
- Growth
- Maturity
- Decline
Some variations add development before launch or split maturity into “maturity” and “saturation,” but the four-stage structure remains the most commonly referenced in practice.
Visual overview of the stages
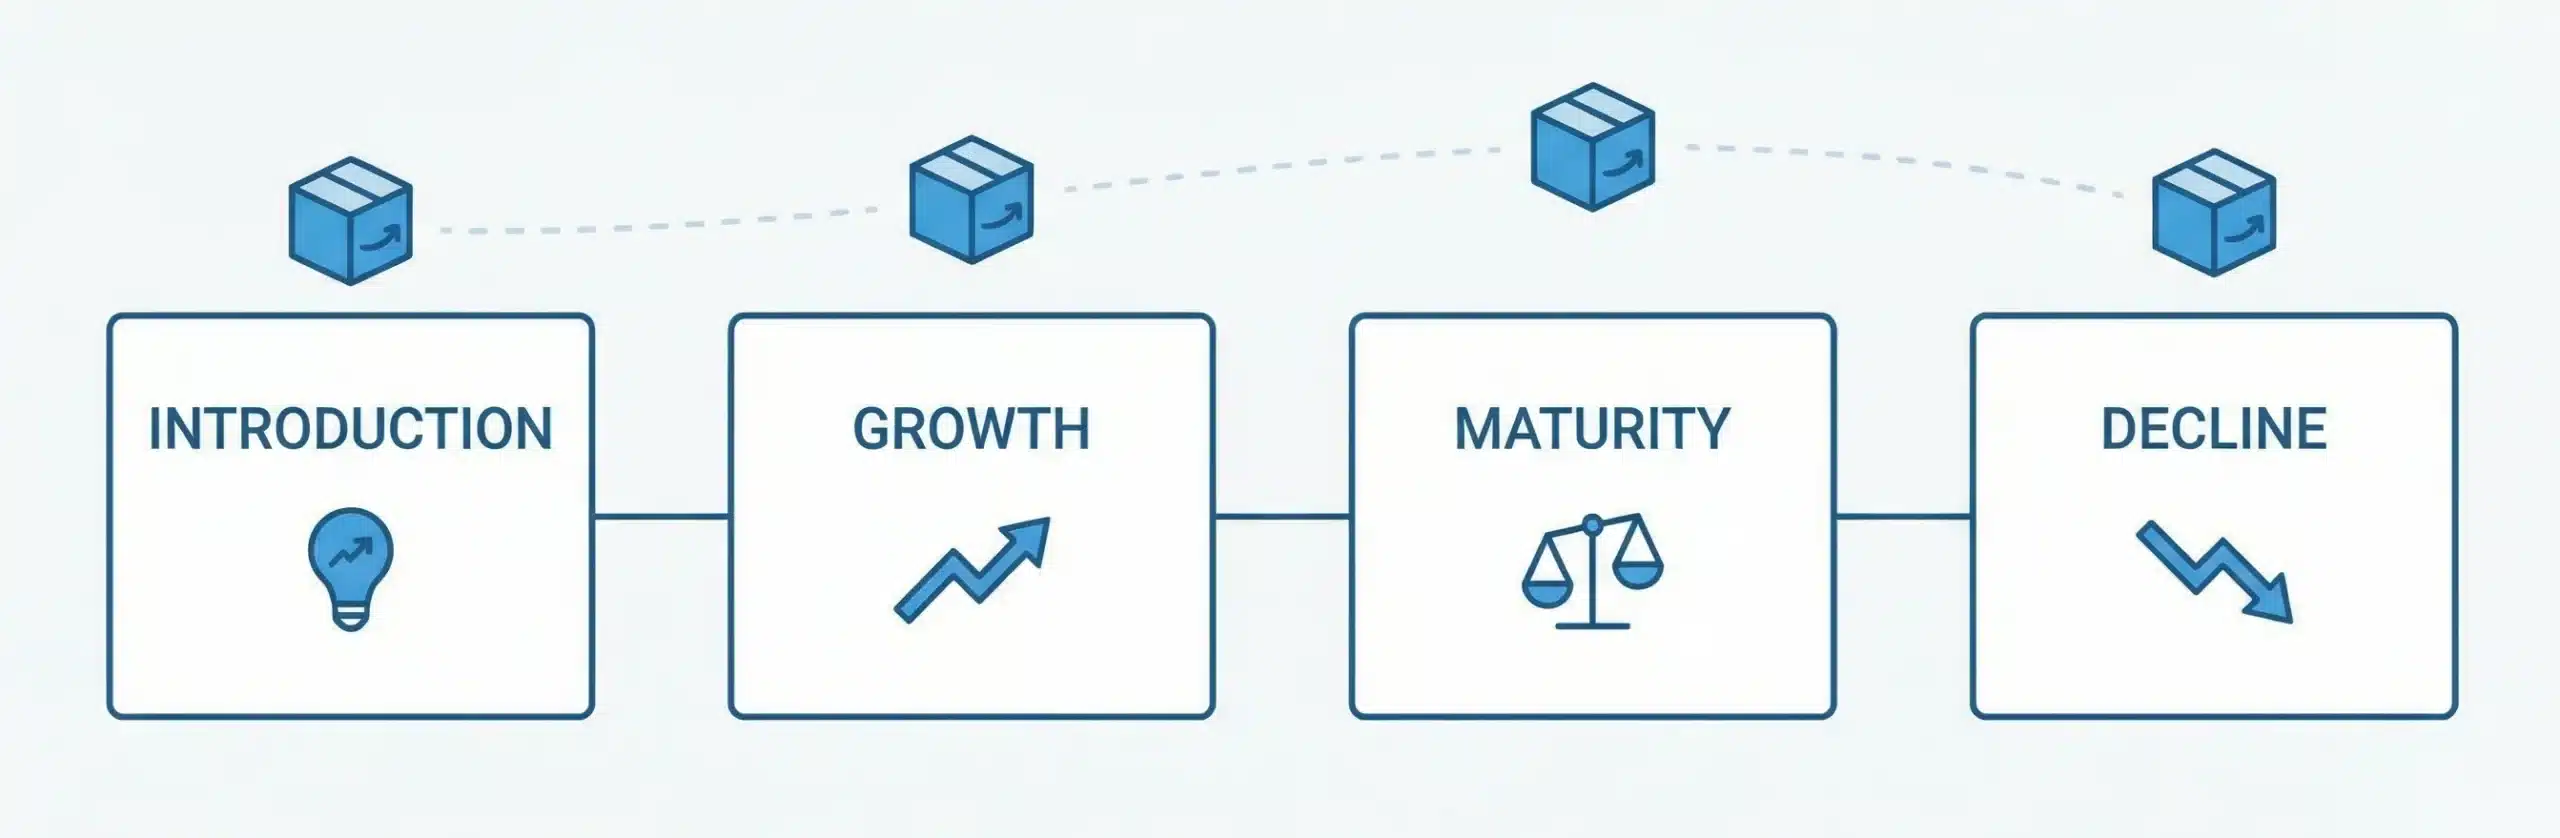
The PLC is often shown as a curve on a graph, with time on the x‑axis and either sales or revenue on the y‑axis. The curve typically starts low in the introduction stage, rises sharply during growth, flattens during maturity, and then falls during decline.
Across this curve:
- Sales and demand start low, accelerate, then plateau and eventually drop.
- Profits usually lag sales at first because launch costs are high, peak in maturity, and contract in decline.
- Competition tends to be limited early, intensifies in growth and maturity, and consolidates in decline as weaker players exit.
Stage 1: Introduction
In the introduction stage, the product has just entered the market, and awareness is low. At this point, demand is still being created, revenues are modest, and investment in development, marketing, and distribution is high relative to sales.
Key characteristics of the introduction stage include:
- Customers are learning what the product is and why it matters, so education is critical.
- Unit costs are often higher due to small-scale production and ongoing refinement.
- Competition is limited but uncertainty is high, as the market’s true potential is still being tested.
Typical KPIs at this stage focus less on profit and more on early traction and learning:
- Brand and product awareness (reach, impressions, search interest)
- Early adoption (sign‑ups, trials, first purchases)
- Customer feedback and product–market fit indicators
Marketing strategies in the introduction stage usually emphasize:
- Clear positioning: Explain what the product is, who it’s for, and why it’s different.
- Education‑led content: Guides, explainer videos, and demos that reduce uncertainty and perceived risk.
- Launch campaigns: Paid social, search ads, PR, and influencer partnerships to build initial awareness quickly.
Examples of products currently or recently in this stage include lab‑grown meat, certain AR glasses, and early self‑driving car offerings, which all require significant education and proof of value before mainstream adoption.
Stage 2: Growth
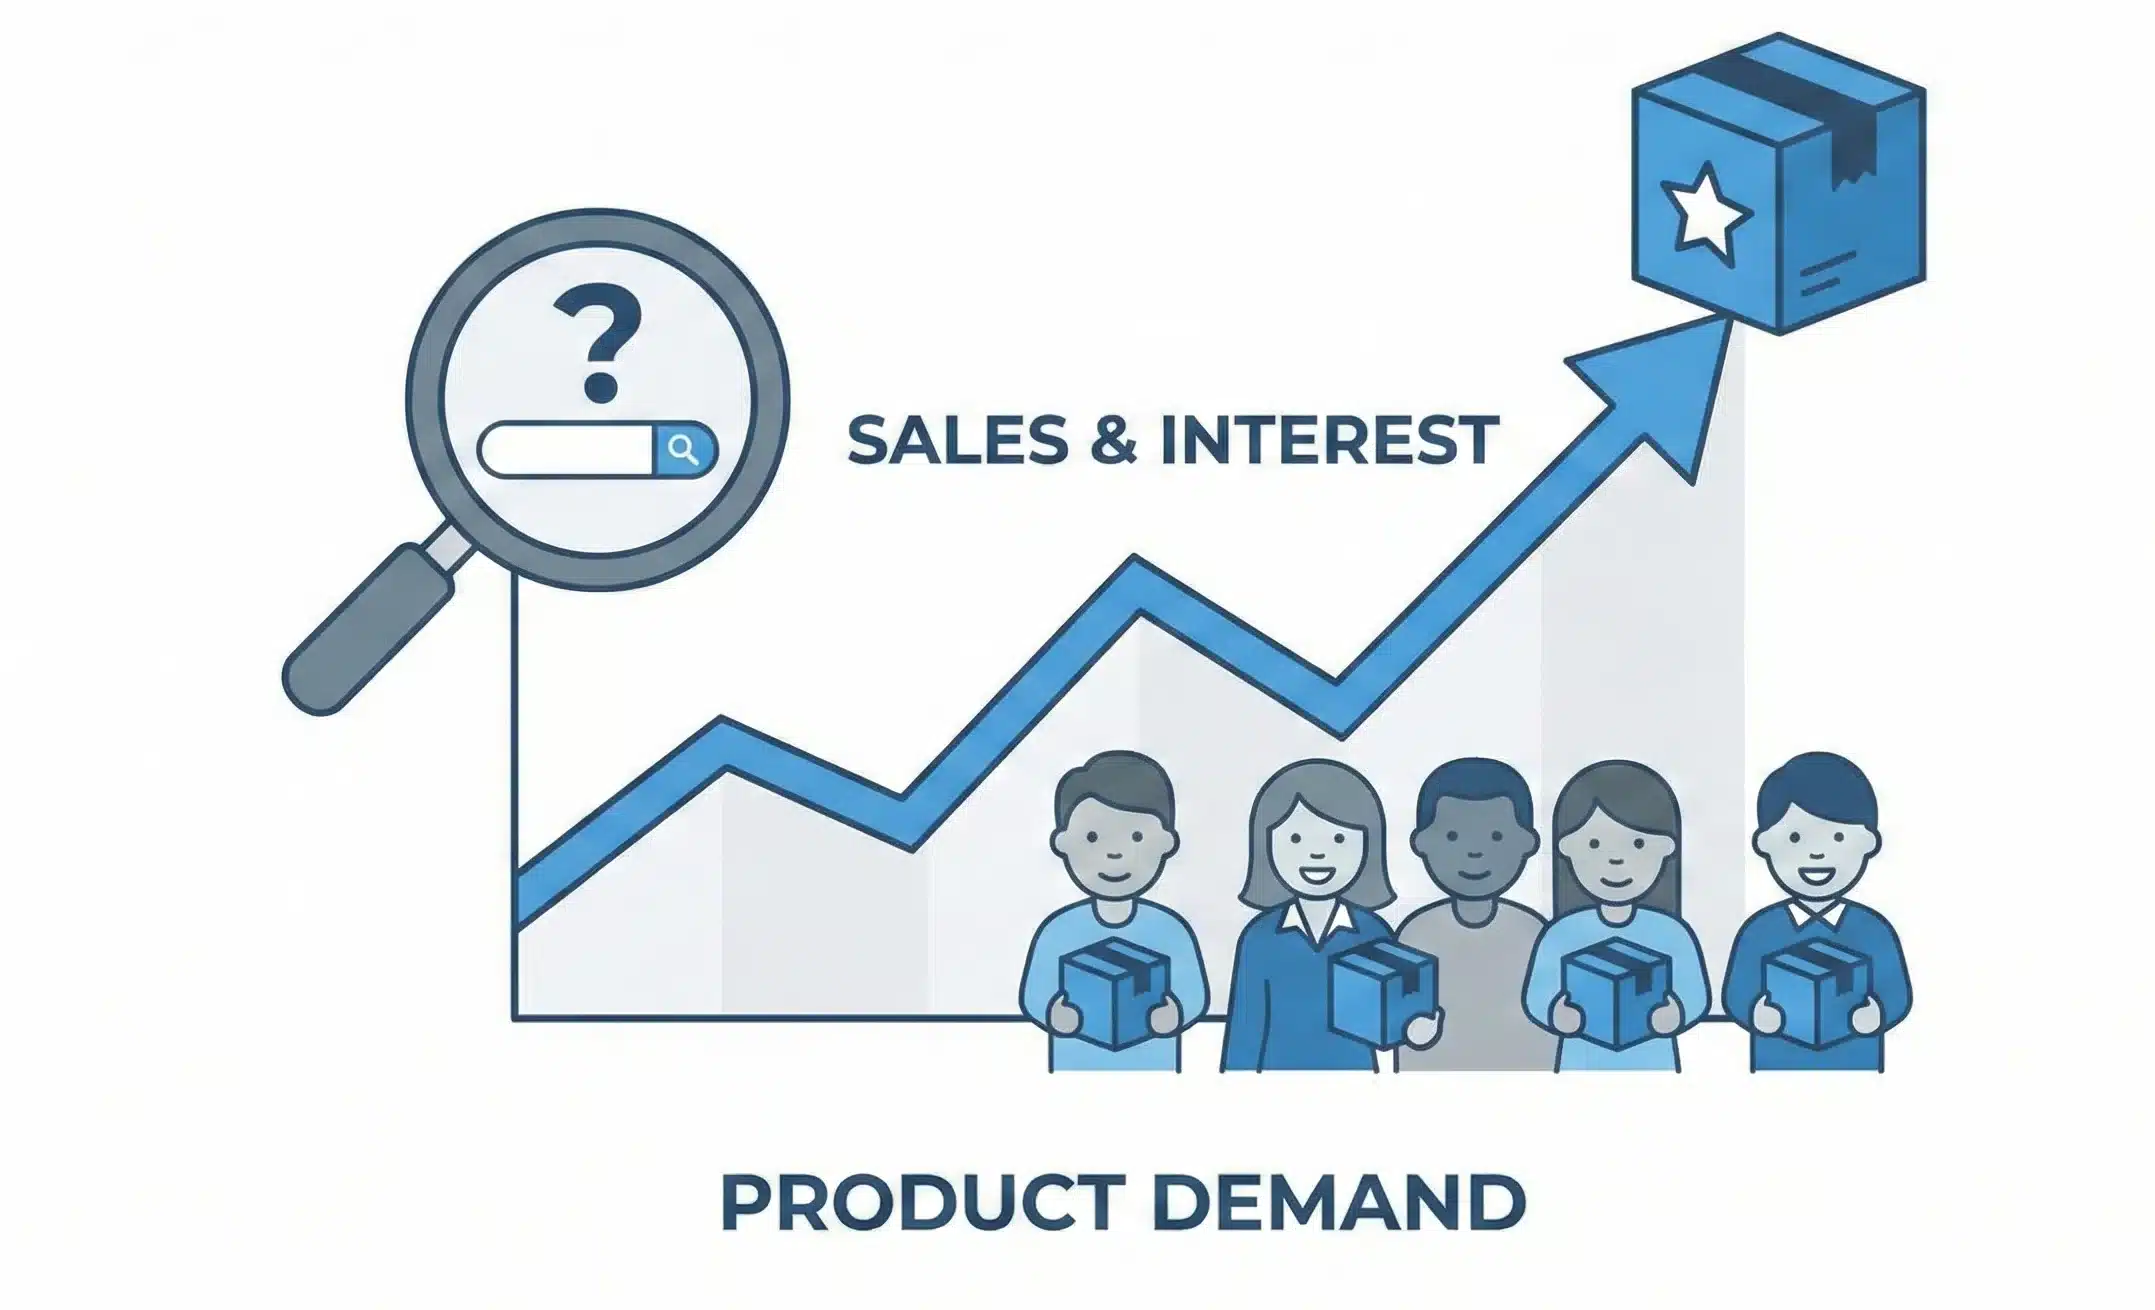
The growth stage begins once the product gains market acceptance and demand starts rising rapidly. Sales increase, economies of scale improve margins, and the market becomes more visible and attractive to competitors.
Typical characteristics of growth include:
- Strong month‑over‑month or year‑over‑year sales growth
- Increasing brand recognition and word‑of‑mouth
- More entrants offering similar products or alternatives
Key KPIs commonly tracked in growth:
- Customer acquisition volume and cost
- Market share within the category
- Customer lifetime value (LTV) vs. acquisition cost (CAC)
- Retention and repeat purchase rates
Marketing strategies in the growth stage tend to focus on scaling demand and differentiating the brand:
- Performance marketing and SEO to capture growing search and purchase intent
- Social proof through reviews, testimonials, and case studies to build trust at scale
- Product line extensions or variants (sizes, bundles, tiers) to appeal to different segments and increase share of wallet
- Expansion of distribution channels (marketplaces, retailers, new regions)
Recent examples of products in a growth phase include categories like electric vehicles, AI tools, and fitness trackers, all of which show rapid demand growth and intensifying competition.
Stage 3: Maturity
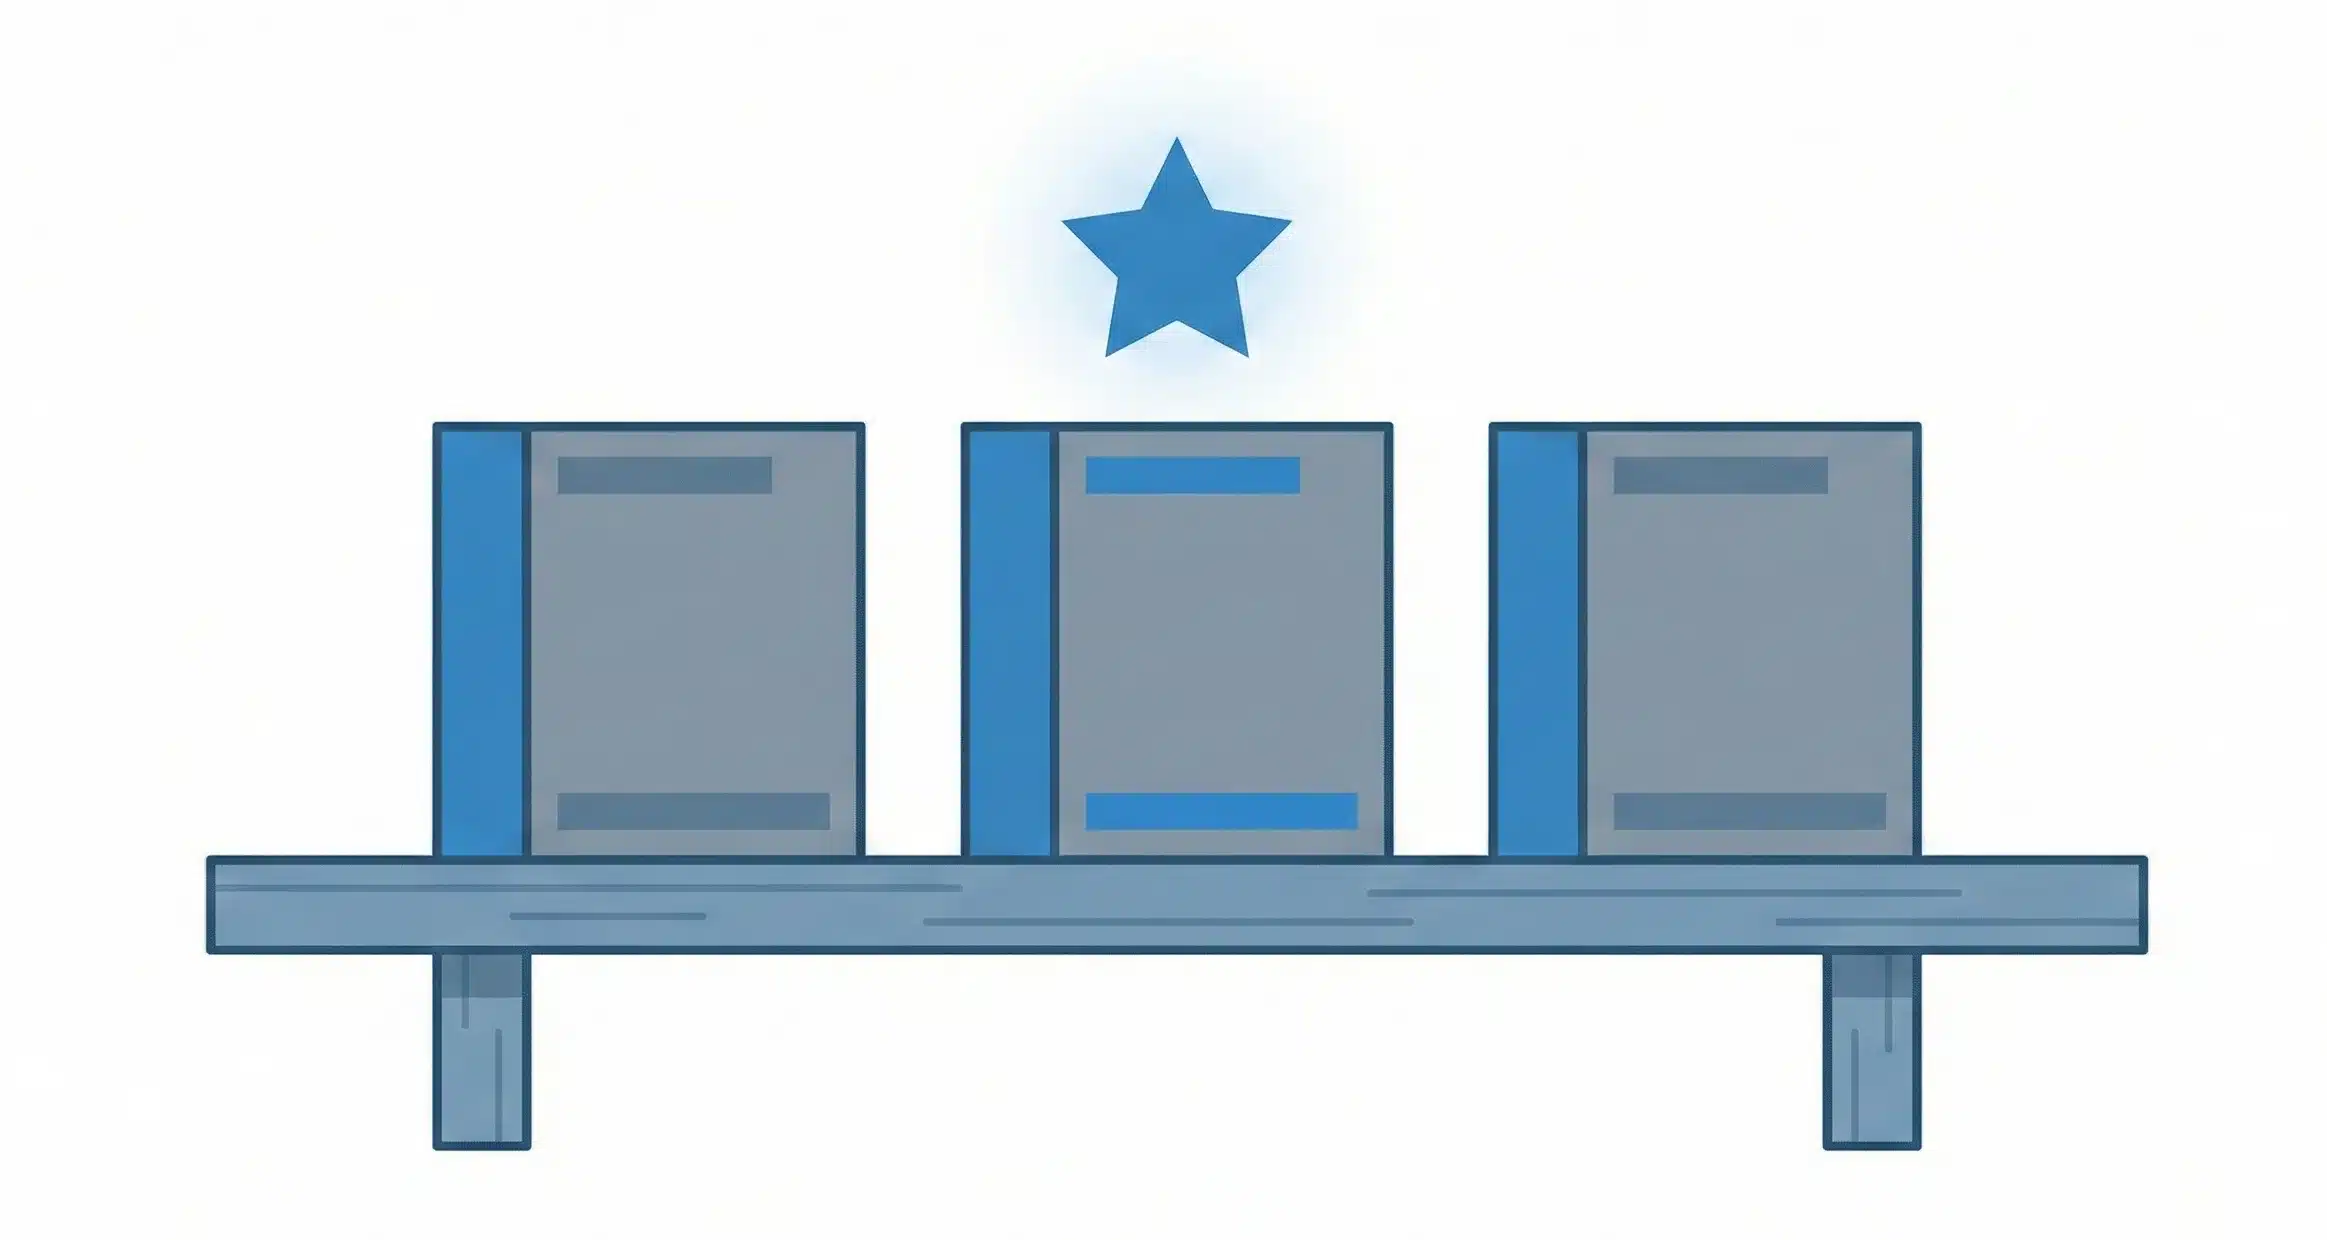
During the maturity stage, the product’s sales growth slows and eventually stabilizes, often at the highest absolute level. The category is well established, most potential customers are aware of the product type, and intensifying competition puts pressure on margins and pricing.
Common characteristics of maturity include:
- Sales volume at or near its peak, with slower growth or flat trends
- High brand and category awareness among target customers
- Many competitors with similar offerings, leading to commoditization risks
KPIs in maturity focus heavily on defending the base and maximizing profitability:
- Market share and share of voice relative to competitors
- Profit margins and contribution per customer or product line
- Retention, loyalty, and repeat purchase metrics
- Upsell/cross‑sell performance within the existing customer base
Marketing strategies at this stage typically shift toward:
- Strong brand differentiation through positioning, storytelling, and unique value propositions
- Retention and loyalty programs such as memberships, rewards, and exclusive experiences
- Product improvements and incremental innovations that keep the offering relevant without fundamentally changing its core
- Omnichannel presence and consistent experiences across digital and physical touchpoints
Subscription streaming services like Netflix in the mid‑2010s and cable TV in the 1990s are widely cited examples of products or services operating in a maturity phase, with high adoption and intense competition.
Stage 4: Decline
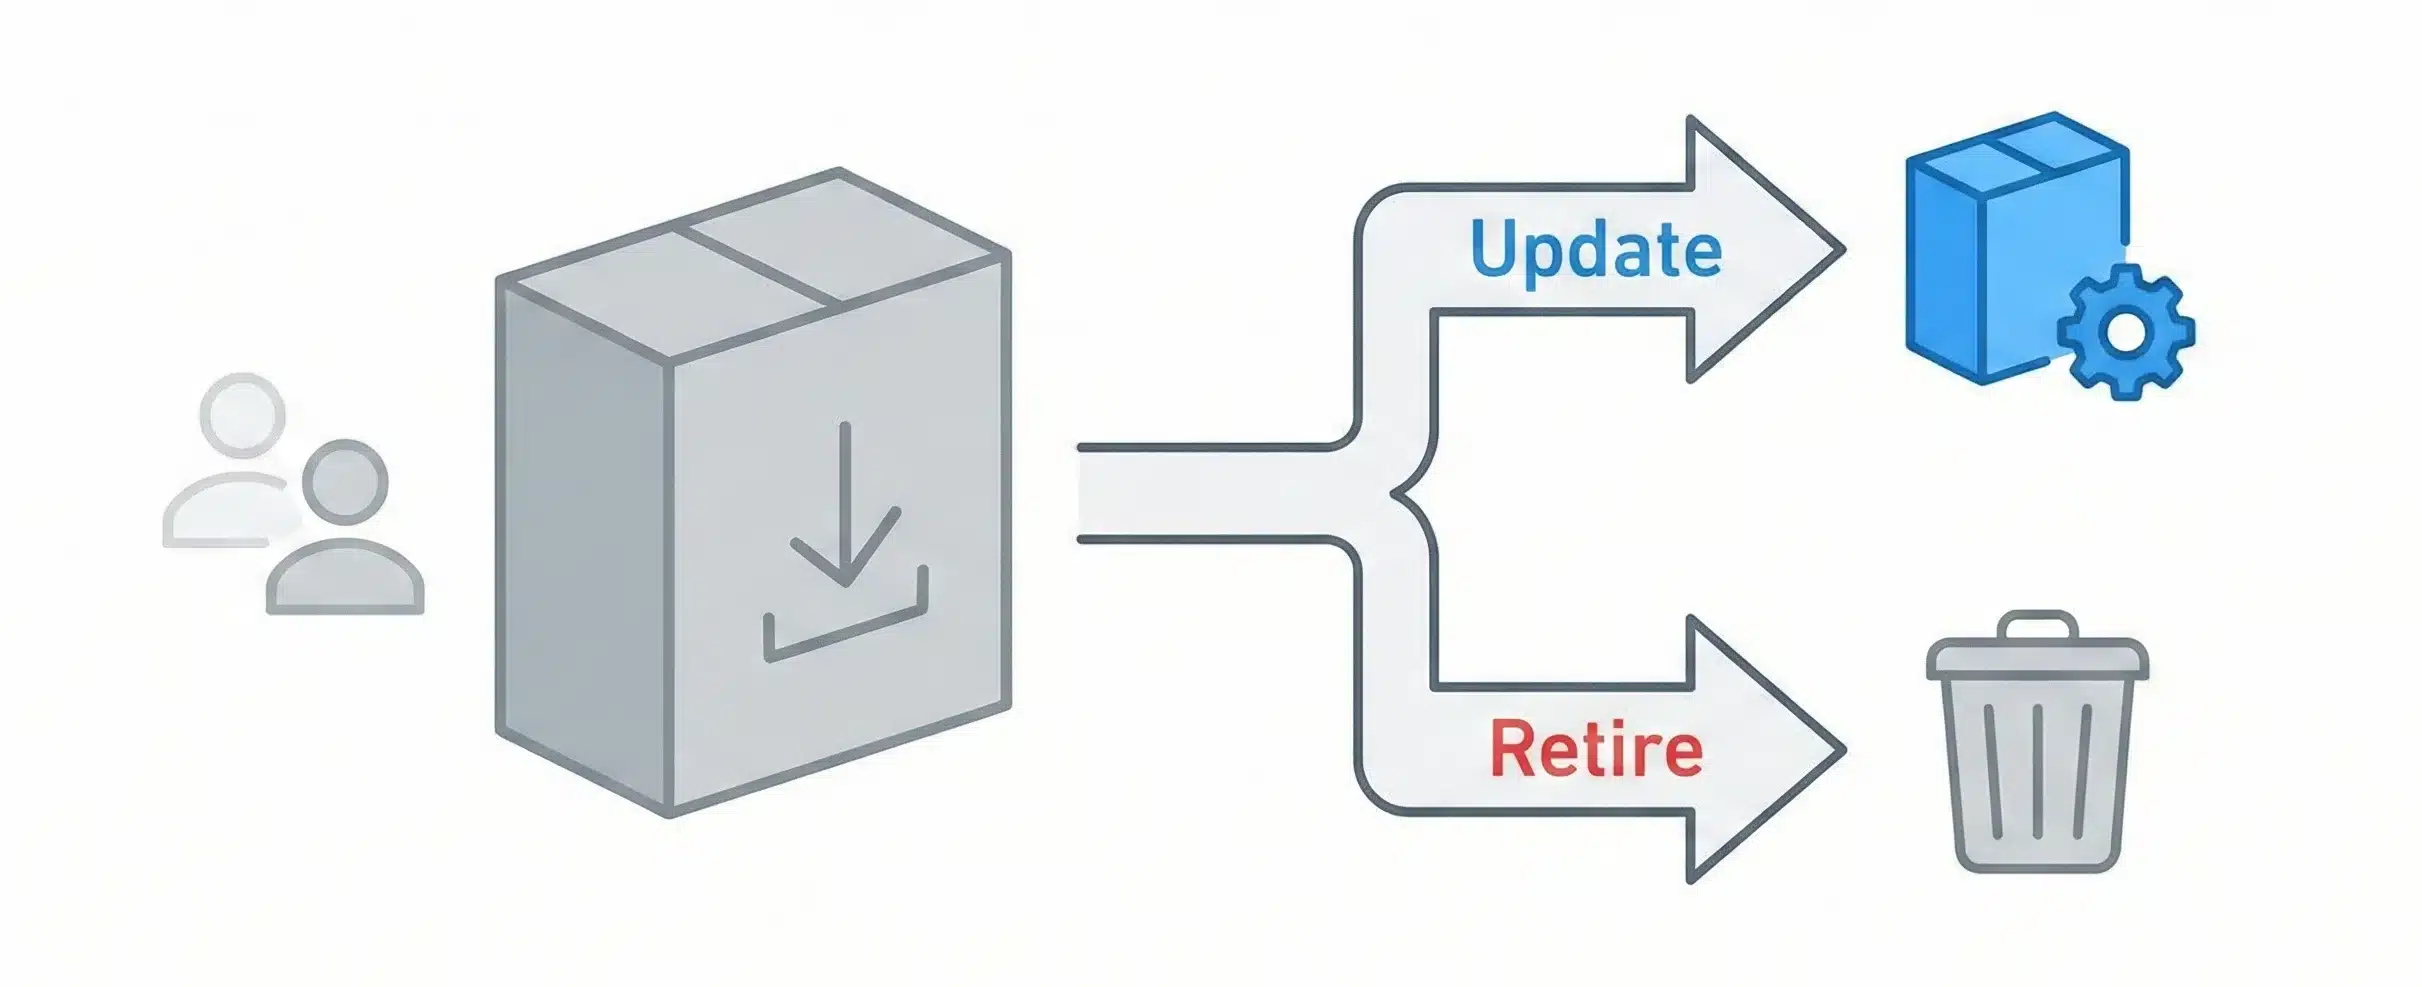
In the decline stage, demand for the product decreases, often because new technologies, changing preferences, or better alternatives have emerged. Sales and profits shrink, and many competitors either exit the category or consolidate.
Typical characteristics of decline include:
- Persistent negative sales trends over time
- Reduced marketing investment from many players in the category
- Stock‑keeping unit (SKU) rationalization, with weaker variants phased out
Key KPIs in this stage focus on managing the exit or repositioning efficiently:
- Rate of sales decline and residual demand
- Profitability after support, inventory, and channel costs
- ROI of continued marketing and operational support
Strategic options for the decline stage include:
- Harvesting: Reducing investment while continuing to sell to remaining loyal customers to maximize short‑term cash flow
- Niche focus: Serving a smaller segment that still values the product (e.g., enthusiasts or specialized use cases)
- Repositioning or innovation: Updating, rebranding, or combining the product with new features to effectively restart its life cycle
- Discontinuation: Phasing out the product, selling remaining inventory, and reallocating resources to stronger lines
Examples of products that have moved into decline include Blockbuster video rental stores, VHS tapes, CDs, and traditional typewriters, all of which were gradually replaced by digital or more efficient solutions.
Product life cycle examples
Real‑world examples make the PLC easier to understand because you can see each stage in action. Products like cable TV, VHS, CDs, and typewriters show how technology and consumer behavior shape each stage.
- Cable TV
- Introduction: Cable TV emerged in the mid‑20th century as a way to expand channel access.
- Growth: Adoption climbed for decades as households sought more content and better reception.
- Maturity: By the 1990s, penetration in many markets was high and the model was well established.
- Decline: Streaming platforms and on‑demand services have led to cord‑cutting and a sustained decline in traditional cable subscriptions.
- VHS
- Introduction: VHS brought home video playback to consumers in the 1970s.
- Growth: As more households bought VCRs and tapes, the format dominated home entertainment for years.
- Maturity: Ownership and rental availability peaked in the late 1990s and early 2000s.
- Decline: DVDs, and later streaming, displaced VHS due to better quality and convenience.
- Typewriters
- Introduction: Commercial typewriters appeared in the late 19th century as a productivity tool for writing.
- Growth: Adoption spread across offices, schools, and homes, becoming a standard tool for written documents.
- Maturity: For decades, typewriters dominated typing tasks worldwide.
- Decline: Word processors and personal computers made typewriters largely obsolete, leaving only niche or nostalgic uses.
- CDs
- Introduction: CDs entered the consumer market in the early 1980s as a digital music format.
- Growth: Households built CD collections and bought CD players for home and portable use.
- Maturity: By the late 1990s and early 2000s, CDs were the dominant format for recorded music.
- Decline: Digital downloads, MP3 players, and later streaming services offered cheaper and more convenient access, driving CD sales down.
Each of these cases shows how external forces like technology and changing preferences can push a product from one stage to the next, regardless of how strong it once was.
Why the product life cycle matters for marketers
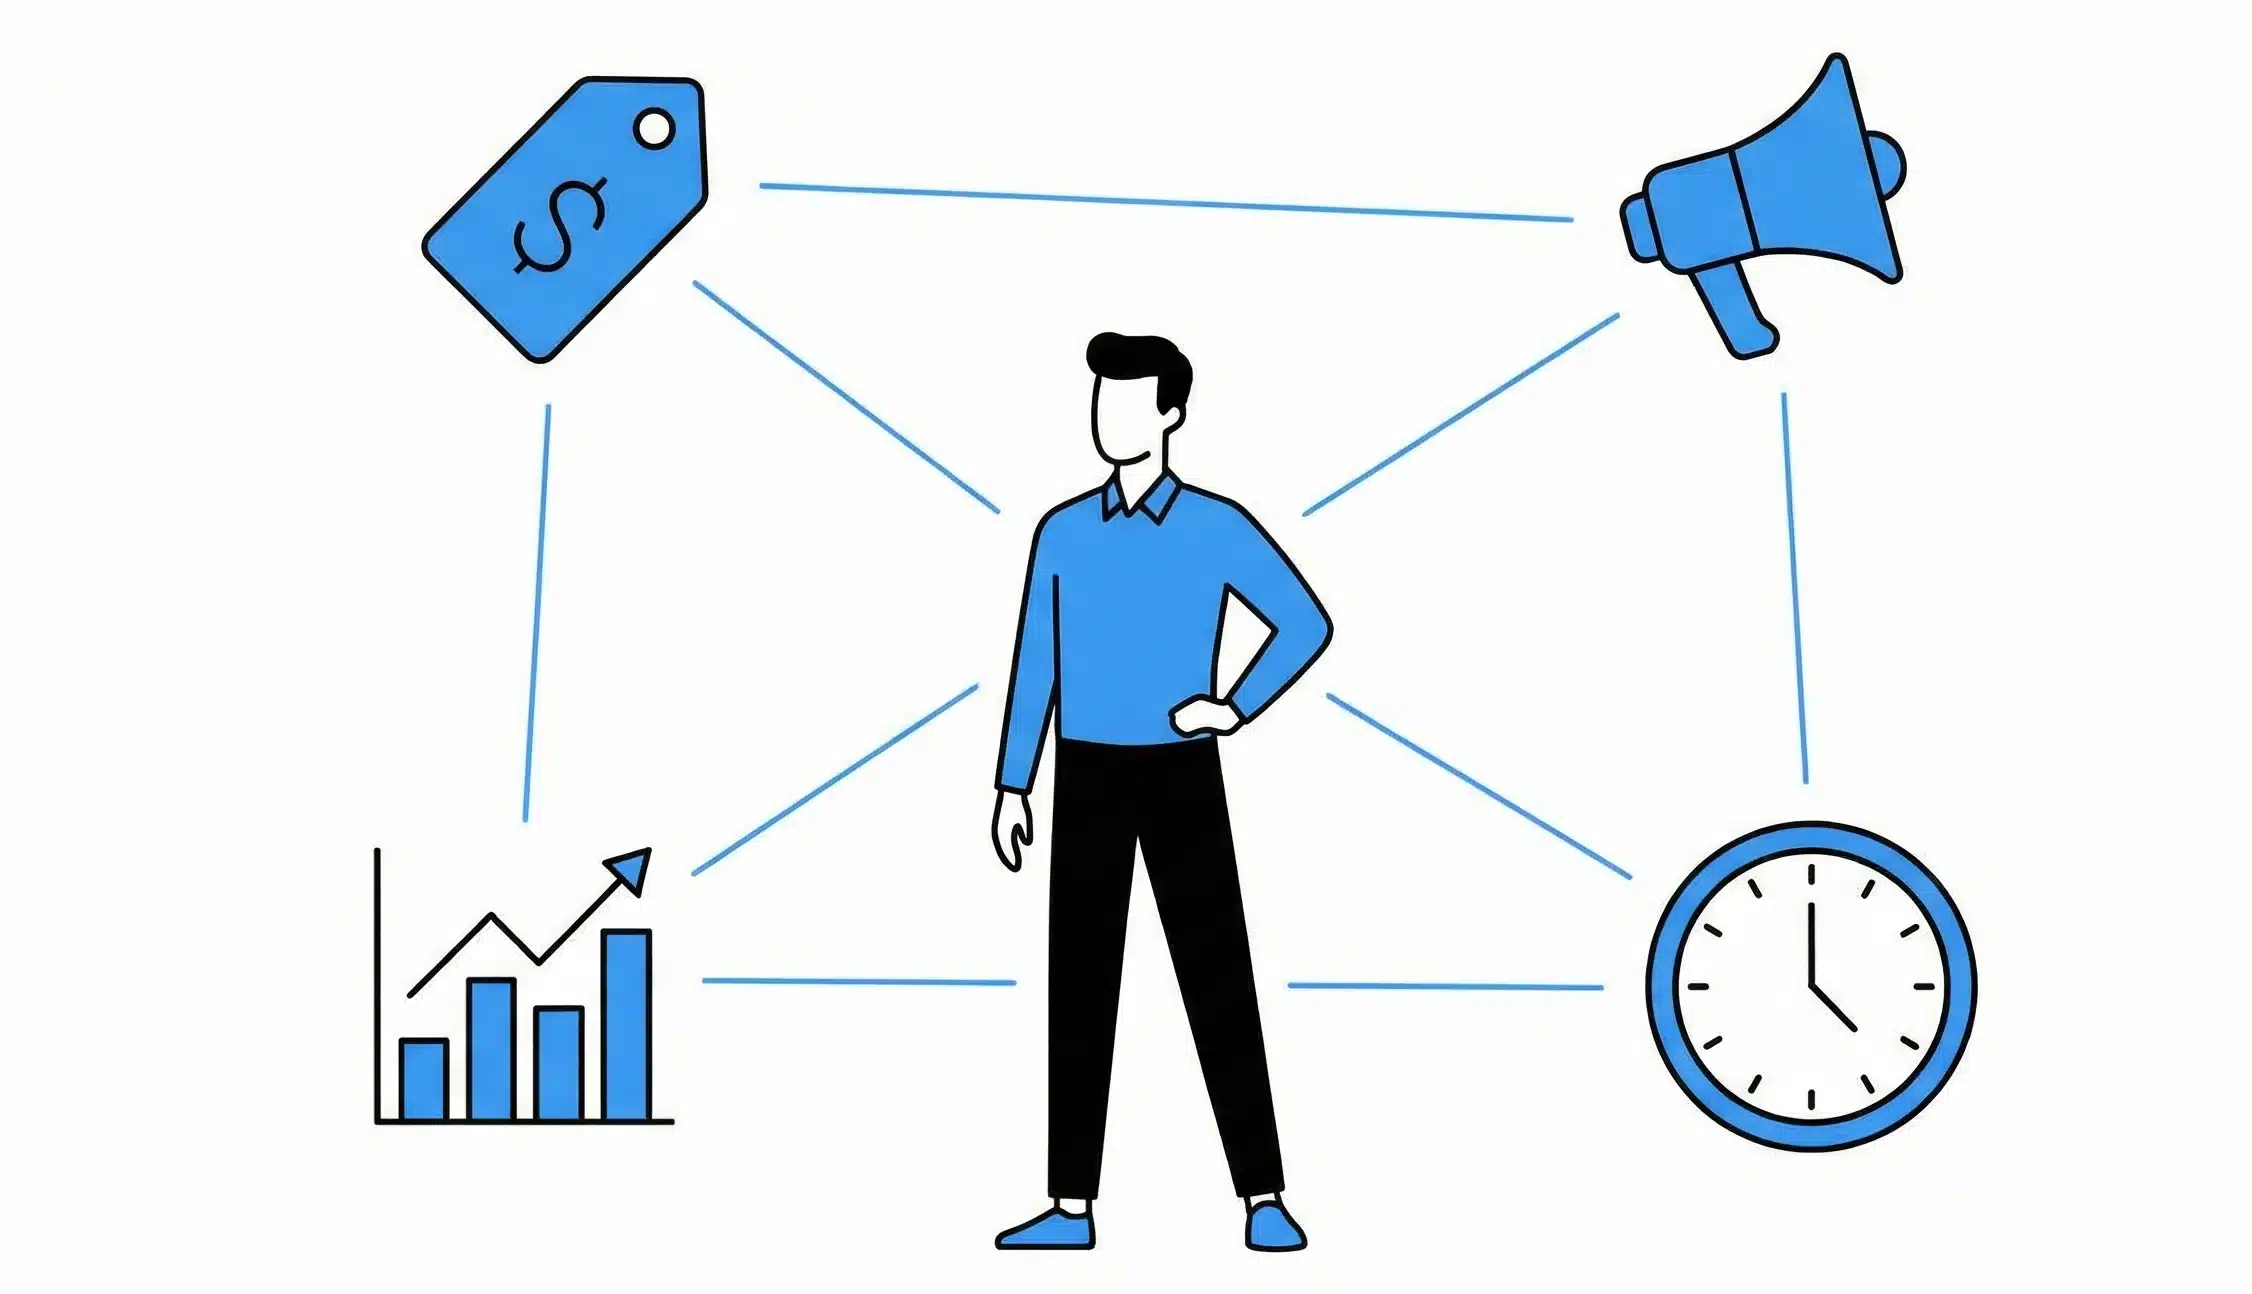
The PLC matters because it aligns marketing decisions with where a product truly is in its market journey, avoiding “one‑size‑fits‑all” tactics. Knowing the stage helps you prioritize channels, messages, and budgets that match the current realities of demand and competition.
When marketers use the PLC model well, they can:
- Plan long‑term by anticipating future stages instead of reacting only to short‑term performance
- Extend product longevity through timely improvements, repositioning, or line extensions before decline accelerates
- Optimize marketing strategies by shifting focus from awareness, to acquisition, to retention, and finally to harvesting or transition
- Improve sales and revenue predictability by matching offers and campaigns to customer readiness at each stage
Key factors that influence a product’s life cycle
Not all products move through the PLC at the same speed; some spend decades in growth or maturity, while others move through all stages in a few years. A product’s trajectory is heavily influenced by external and internal factors.
Important influences include:
- Market competitiveness: Highly competitive categories often see faster imitation, more price pressure, and shorter maturity phases
- Economic conditions: Recessions, booms, and global events can accelerate decline or delay growth, especially for non‑essential products
- Technology changes: Breakthroughs can render existing products less attractive or obsolete, as digital media did to physical formats
- Consumer preferences: Shifts in lifestyle, values, or demographics can move demand away from certain products
Because these factors are partly outside a company’s control, ongoing market research and monitoring are essential to adapt strategies before performance deteriorates.
Limitations and misconceptions of the product life cycle
Despite its usefulness, the PLC is a simplified model and should not be treated as a precise forecast. One limitation is that it does not specify how long each stage will last, and in reality, stage length varies widely between products and industries.
Other limitations and misconceptions include:
- Non‑linear behavior: Products can stall, revive, or jump stages due to innovation, rebranding, or sudden shifts in demand
- Imperfect fit for services: Pure services and platforms may not follow the same patterns as physical products and might require adapted models
- Risk of self‑fulfilling expectations: Treating decline as inevitable too early can lead to under‑investment that accelerates the drop
- Need for complementary tools: The PLC should be combined with data analysis, customer research, and other frameworks rather than used in isolation
Used thoughtfully, the PLC is best seen as a guide to ask better questions, not as a rigid script that every product must follow exactly.
Product life cycle vs. BCG Matrix
The PLC is not the only tool available for thinking about products over time; the Boston Consulting Group (BCG) Matrix is another popular framework. While both help with strategic decisions, they look at products in different ways.
The product life cycle:
- Focuses on stages over time (introduction, growth, maturity, decline)
- Emphasizes changes in sales, profits, and competitive dynamics throughout a product’s life
The BCG Matrix:
- Plots products on a grid based on relative market share and market growth, grouping them as Question Marks, Stars, Cash Cows, or Dogs
- Is primarily a portfolio and investment tool, indicating where to invest, maintain, harvest, or divest within a set of products
In practice:
- The PLC is most useful for lifecycle strategy, messaging, and timing product decisions (e.g., when to refresh or withdraw a product)
- The BCG Matrix is more useful when deciding how to allocate resources across multiple products or business units based on their market position
Many companies use both: the PLC to guide stage‑specific tactics for each product, and the BCG Matrix to decide which products deserve more or less investment.
Related Read: What Are Marketing Channels? Types, Importance & Examples
Actionable strategies by stage (practical playbook)
This section turns theory into practice by linking each PLC stage to specific, high‑level strategic moves. The aim is to help you quickly see how your marketing and product focus should shift over time.
- Introduction
- Prioritize education and clarity in messaging to reduce confusion and perceived risk
- Target early adopters who are more open to trying something new, even if it’s imperfect
- Use launch campaigns, PR, and content to build visibility and gather feedback loops for rapid iteration
- Growth
- Scale acquisition channels like SEO, paid search, and social ads to capture rising demand efficiently
- Strengthen brand positioning to stand out as new competitors arrive
- Expand features, variants, or bundles based on customer feedback and segment needs
- Maturity
- Optimize pricing, discounts, and bundles to protect margins while staying competitive
- Deepen retention with loyalty programs, account management, and ongoing value communication
- Invest in incremental innovation and adjacent offerings that keep the product relevant and expand revenue per customer
- Decline
- Decide whether to sunset, rebrand, or reinvent based on residual demand and strategic fit
- Reduce complexity by trimming low‑performing SKUs and managing inventory carefully
- Communicate clearly with customers about changes and, if relevant, guide them toward newer or alternative offerings
How to apply the product life cycle to your business
Applying the PLC in a practical way starts with honestly assessing where each product stands today. From there, you can align your marketing mix, product roadmap, and investment levels with the most likely needs of that stage.
A simple way to get started is to:
- Identify the current stage by looking at sales trends, profitability, competition, and adoption patterns rather than assumptions
- Audit your current marketing and product activities to see whether they fit the realities of that stage or are misaligned
- Adjust your marketing mix (product, price, place, promotion – and, for services, people, process, physical evidence) to better match the stage‑specific strategies described above
- Set clear goals and metrics that reflect the stage: awareness and learning in introduction, acquisition and share in growth, retention and profitability in maturity, and efficient management or transition in decline
By regularly revisiting these steps and combining PLC insights with data, customer research, and experimentation, you can keep products relevant longer and make more deliberate decisions about when to invest, refresh, or retire them.
Conclusion
The product life cycle gives a clear, practical way to think about how products behave over time, from launch to eventual decline. When you know whether a product is in introduction, growth, maturity, or decline, you can align your pricing, messaging, and channels with what the market actually needs at that moment.
Used well, the PLC is not a rigid prediction tool but a strategic lens: it helps you anticipate challenges, spot opportunities to extend maturity, and decide when to reinvent or retire a product. Combined with real data and customer insight, it becomes a roadmap for making deliberate, confident decisions across the full life of your products.
FAQs
1. What is the main purpose of the product life cycle?
The main purpose of the product life cycle is to help businesses understand how a product’s sales, profitability, and competitive environment typically change over time. By mapping a product to a specific stage, companies can choose more effective strategies for marketing, pricing, product improvements, and resource allocation.
2. Do all products go through every stage of the life cycle?
Most products follow some version of introduction, growth, maturity, and decline, but the path is not always neat or predictable. Some products stall in early stages and never reach maturity, while others are refreshed or repositioned in ways that extend growth or maturity and delay decline.
3. How can a company extend the maturity stage of a product?
Companies often extend maturity by differentiating their brand, adding new features, updating design or packaging, and entering new segments or markets. Adjusting pricing, launching bundles, or expanding distribution can also keep a mature product relevant and attractive for longer.
4. What is the difference between product life cycle and product life cycle management (PLM)?
The product life cycle is a conceptual model that describes stages of market behavior over time. Product life cycle management (PLM) is a broader discipline that covers the processes, tools, and data used to manage a product from idea and design through production, marketing, support, and end‑of‑life decisions.
5. Can services use the product life cycle model too?
Yes, but with adaptations. Services and digital platforms often have different cost structures, update cycles, and customer relationships, so the stages may look less distinct. Even so, thinking in terms of introduction, growth, maturity, and decline can still guide decisions about investment, innovation, and positioning.
6. How do I know which stage my product is in?
You can infer the stage by looking at trends in sales, profit margins, customer acquisition and retention, and the level of competition. Rapidly rising sales and new competitors suggest growth, stable high sales with intense competition suggest maturity, and persistent declines in sales or relevance indicate a move toward decline.
7. What should a business do when a product enters decline?
When a product enters decline, the key is to decide whether to harvest, reinvent, or exit. That might mean reducing investment while serving remaining loyal customers, rebranding or redesigning the product to restart the cycle, or phasing it out and redirecting resources to more promising offerings.

Passionate about blogging and focused on elevating brand visibility through strategic SEO and digital marketing. Always tuned in to the latest trends, I’m dedicated to maximizing engagement and delivering measurable ROI in the dynamic world of digital marketing. Let’s connect and unlock new opportunities together!