


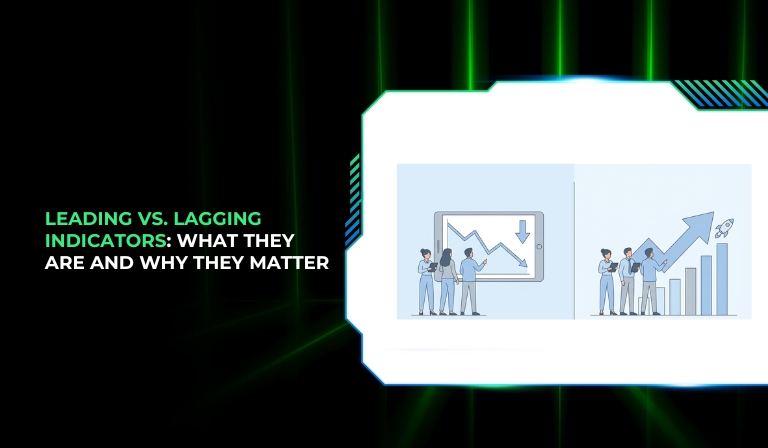
Most businesses track performance regularly, yet many still struggle to improve results consistently. One major reason is how performance is measured. Many teams rely heavily on numbers that explain what already happened, but offer little guidance on what to do next. This creates a reactive way of working, where action is taken only after results decline.
This is where the distinction between leading vs. lagging indicators becomes important. Lagging indicators show final outcomes, while leading indicators help predict and influence future performance. When used together as KPIs, these metrics help businesses move from reactive decision-making to proactive, data-driven strategy.
What Are Lagging Indicators?
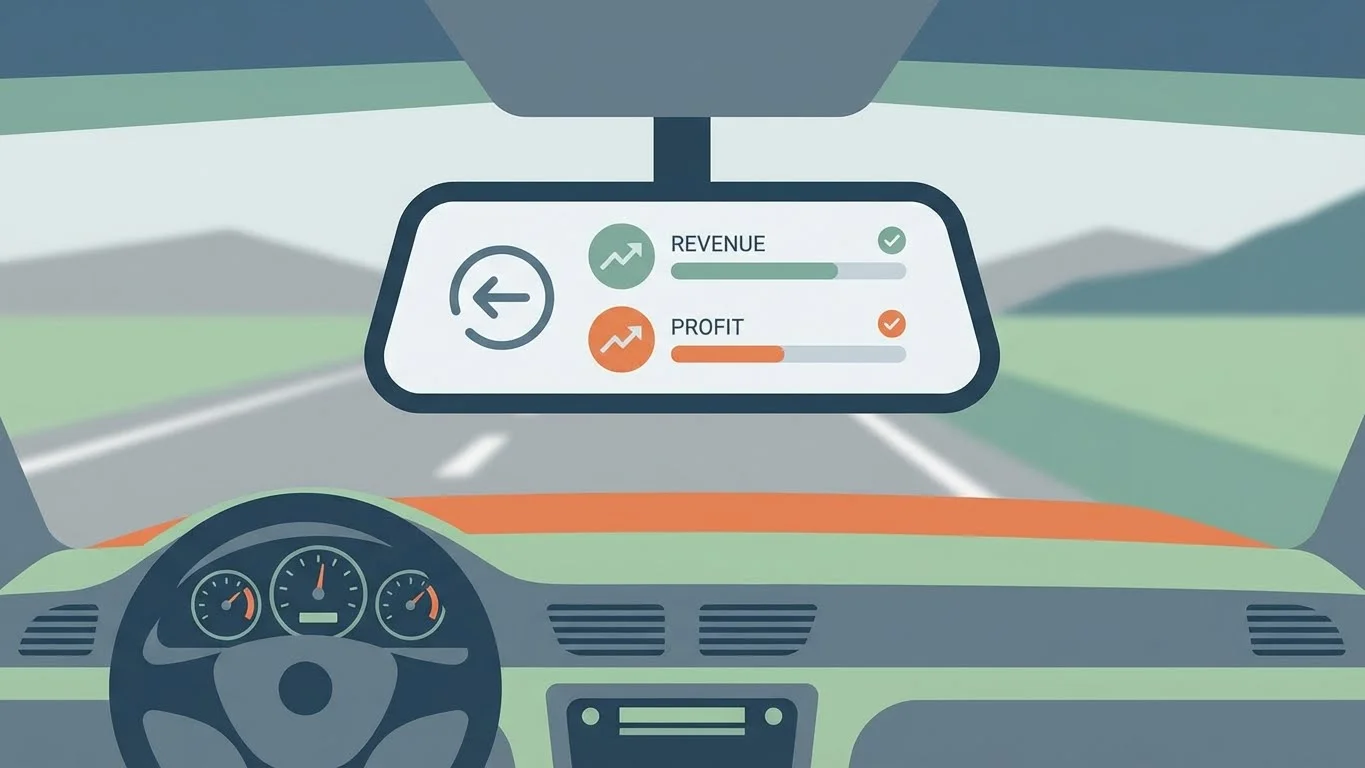
Lagging indicators are outcome-based metrics that measure results after an activity or process has already been completed. They reflect past performance rather than future potential.
They are called “lagging” because they change after business actions have already taken place. In simple terms, they act like a rear-view mirror, showing where the business has been, not where it is going.
Lagging indicators are widely used because they are:
- Easier to measure
- Clearly defined
- Directly tied to business results
However, their simplicity comes with a limitation: they do not explain why the result happened.
Why Lagging Indicators Matter for Business
Lagging indicators play a critical role in business measurement and reporting because they confirm whether goals were achieved.
- They provide clear accountability by showing final outcomes
- They help benchmark performance against targets, budgets, or historical data
- They are essential for financial reporting and stakeholder communication
- They support long-term trend analysis and forecasting
At the same time, lagging indicators have limited actionability. Since they describe past events, they do not allow teams to correct issues before damage is done.
Common Examples of Lagging Indicators
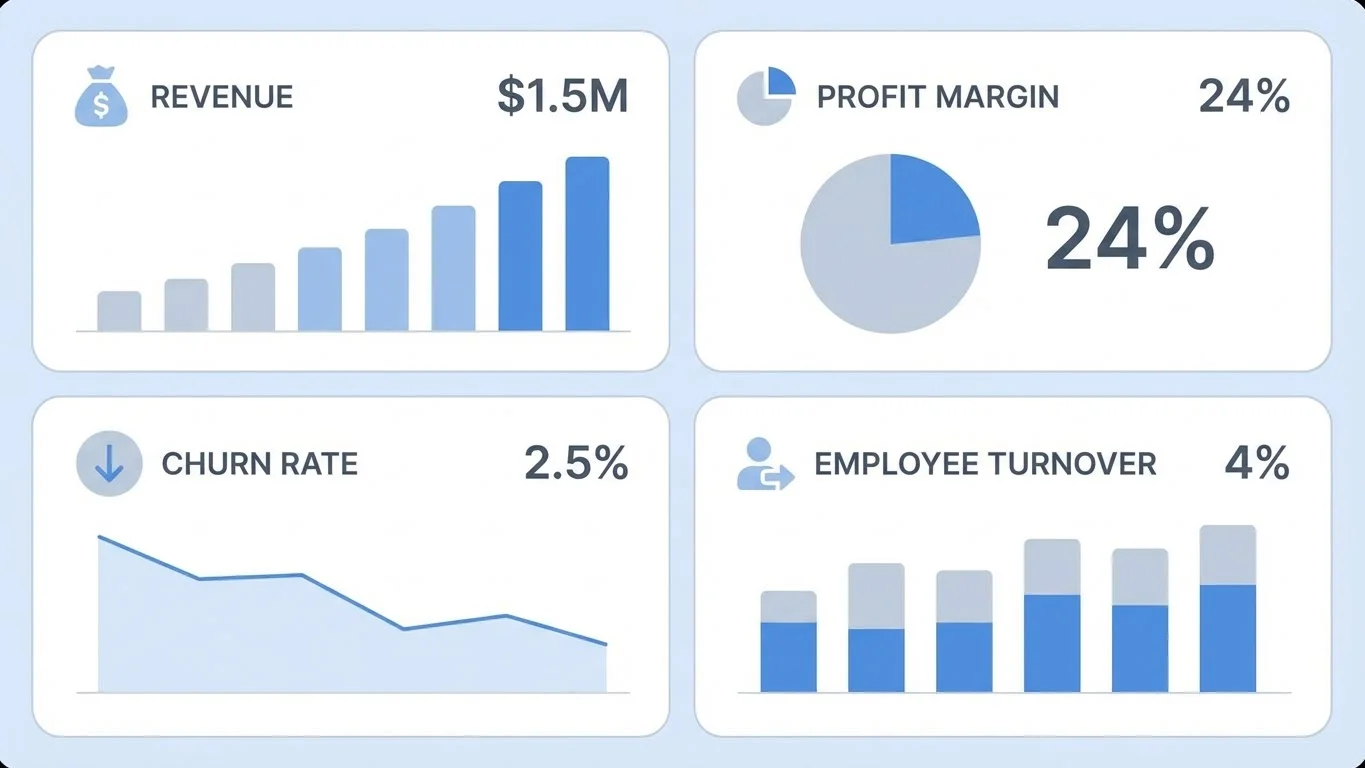
- Revenue and sales (monthly, quarterly, annual)
- Net profit and profit margins
- Customer churn rate
- Customer lifetime value (CLV)
- Average revenue per user (ARPU)
- Employee turnover rate
- Customer satisfaction scores (such as NPS)
- Daily active users (DAU) and monthly active users (MAU)
- Mean time to resolution for customer support
What Are Leading Indicators?
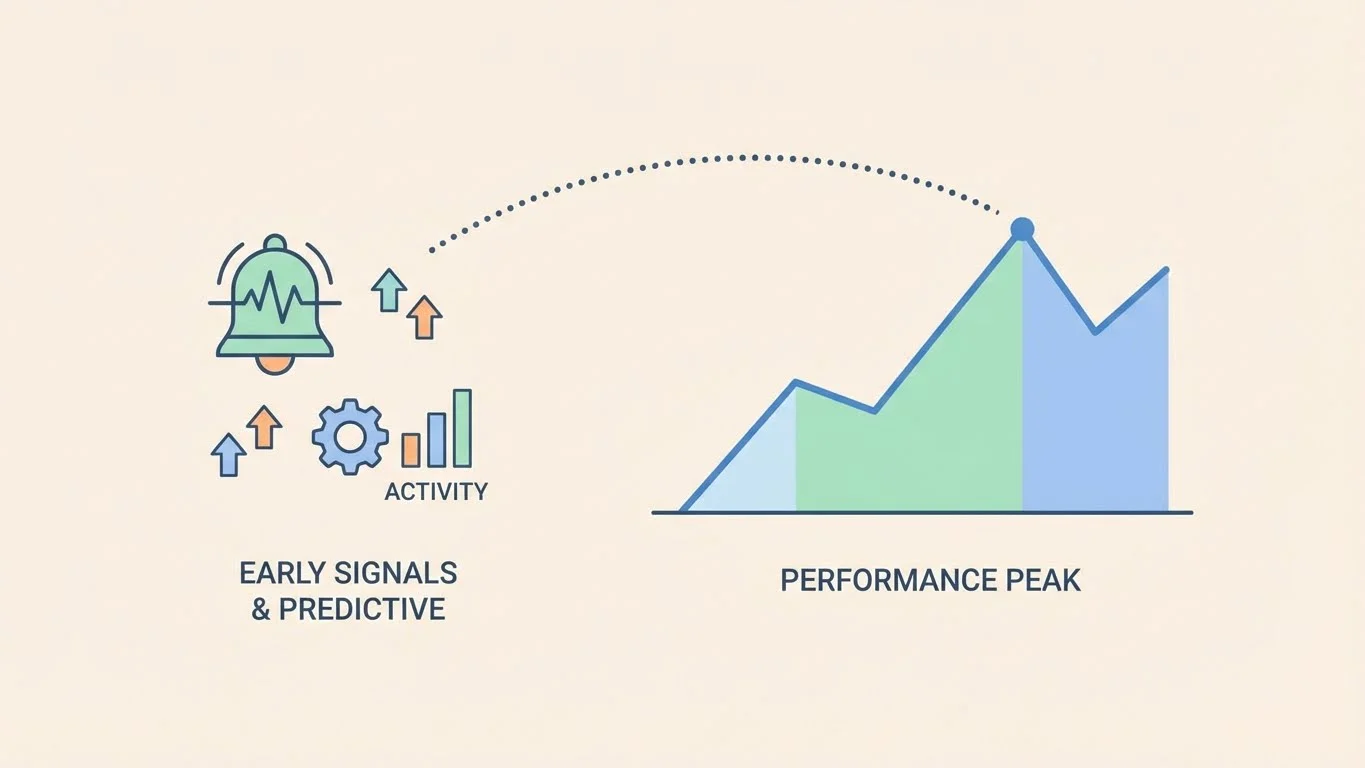
Leading indicators are predictive metrics that signal future performance. Instead of measuring final outcomes, they track behaviors and activities that influence those outcomes.
They act as an early warning system, helping businesses identify potential success or failure before results appear. Most leading indicators are operational or behavioral, making them more dynamic but also harder to define correctly.
Leading indicators support proactive decision-making by highlighting what actions need attention right now.
Why Leading Indicators Matter for Business
Leading indicators help organizations influence outcomes instead of reacting to them.
- They enable real-time course correction
- They identify risks and opportunities early
- They provide actionable insights, not just historical data
- They align daily activities with long-term goals
- They support agile strategy and faster adaptation
Because leading indicators focus on controllable actions, they empower teams to improve performance before lagging results are impacted.
Common Examples of Leading Indicators
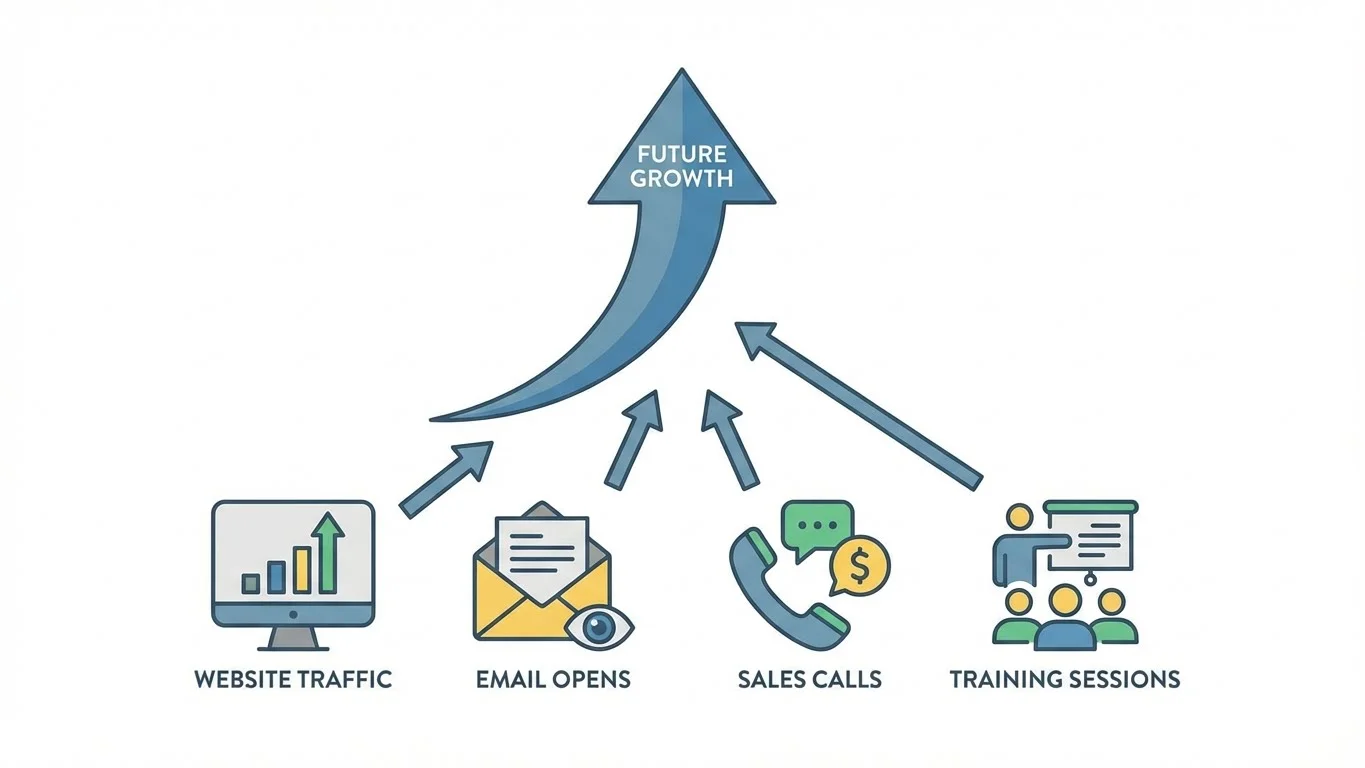
- Number of sales calls or demos conducted
- Website traffic and conversion rates
- Free trial signups
- Social media engagement and reach
- Email open and click-through rates
- Employee training hours
- Customer service inquiries and ticket volume
- Webinar registrations and attendance
- Feature adoption rate in software products
- Qualified leads in the sales pipeline
- Time on site and session duration
Key Differences: Leading vs. Lagging Indicators
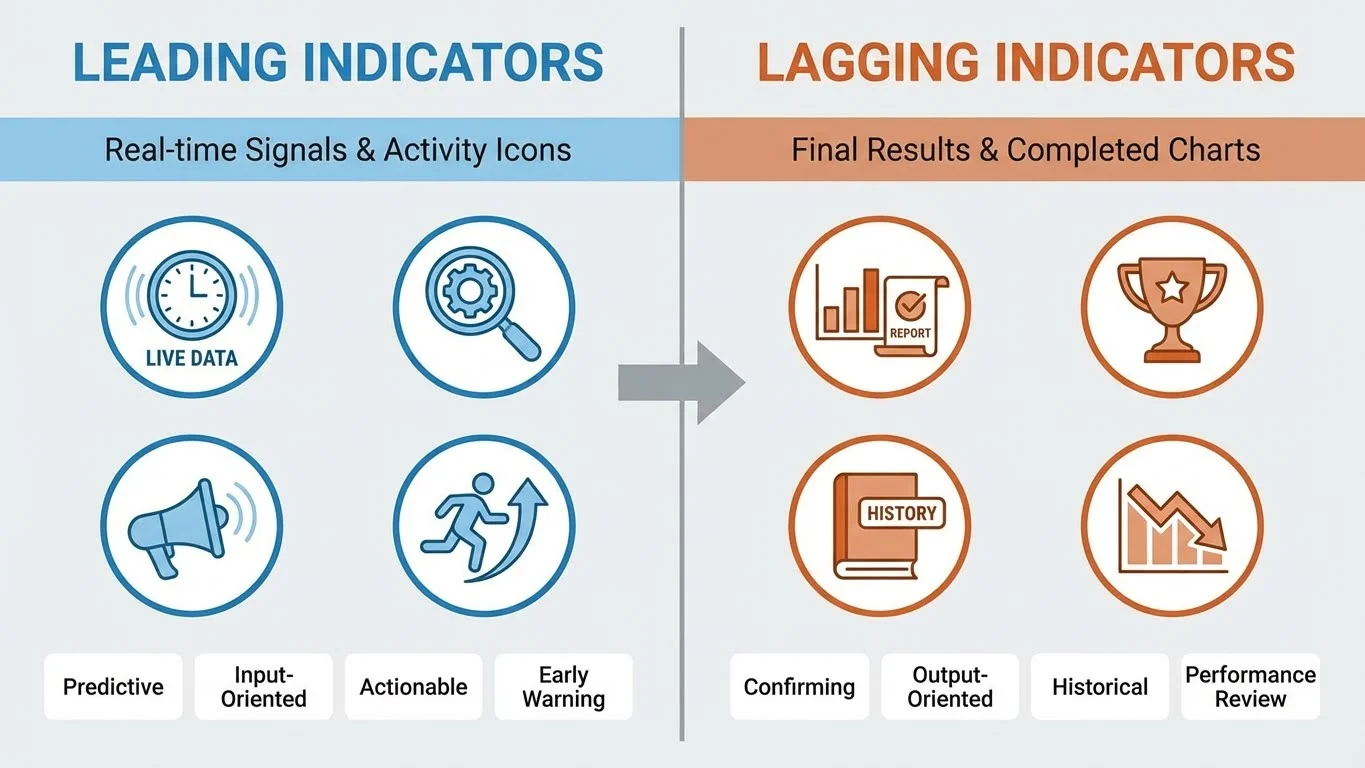
| Aspect | Leading Indicators | Lagging Indicators |
| Focus | Predictive | Retrospective |
| Timing | Real-time or near real-time | After the outcome occurs |
| Actionability | Directly influenceable | Already determined |
| Use Case | Strategy adjustment | Performance validation |
| Measurement Difficulty | More complex | More straightforward |
Why You Need Both: The Case for Balanced Metrics
The Danger of Relying Solely on Lagging Indicators
Depending only on lagging indicators creates a reactive culture. By the time problems appear in revenue or retention metrics, the underlying causes may have existed for weeks or months.
- Issues are discovered too late to fix easily
- Early warning signs are missed
- Revenue declines before corrective action is taken
Why Leading Indicators Alone Aren’t Enough
Leading indicators do not guarantee results. While they show activity levels, they do not confirm whether business objectives were achieved.
- High activity does not always translate into outcomes
- Results are not validated without lagging metrics
- Metrics can become vanity indicators if not tied to goals
The Power of Using Both Together
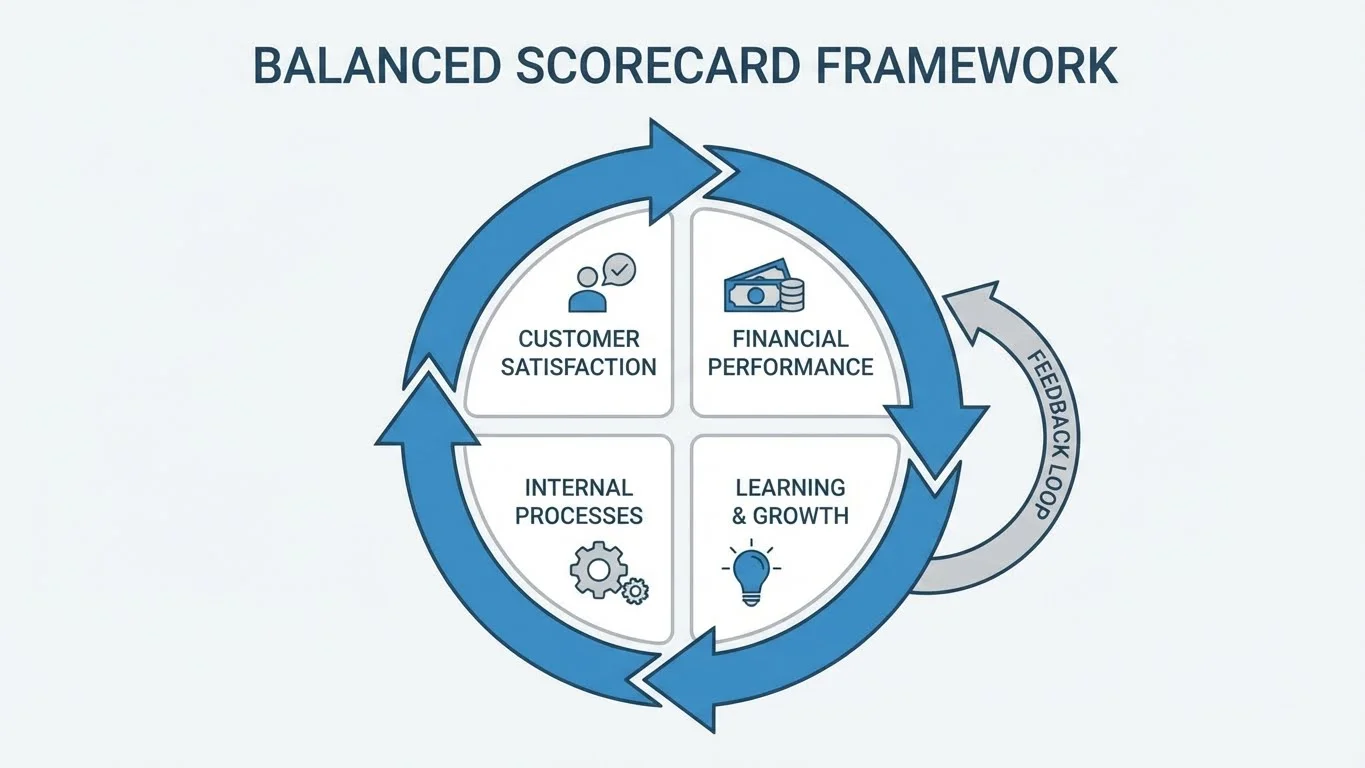
Using leading and lagging indicators together creates a feedback loop.
- Leading indicators predict future outcomes
- Lagging indicators validate actual performance
- Teams align daily actions with measurable results
- This approach supports the Balanced Scorecard framework
How to Use Leading and Lagging Indicators Strategically
Step 1 – Define Your Lagging Goals First
Start with clear business objectives such as revenue growth, retention, or profitability.
- Define outcomes using the SMART framework
- Establish metrics that clearly indicate success or failure
- Assign accountability at the outcome level
Step 2 – Identify Leading Drivers
Determine which activities influence the lagging goals.
- Identify upstream behaviors that impact results
- Establish correlations between actions and outcomes
- Map cause-and-effect relationships clearly
Step 3 – Set Measurable Targets
Targets turn metrics into actionable KPIs.
- Limit KPIs to 3–8 per level
- Assign ownership for every metric
- Ensure metrics are timely and relevant
Step 4 – Monitor Continuously & Correlate
Tracking must be consistent and visible.
- Use dashboards for real-time monitoring
- Track leading and lagging metrics together
- Identify patterns and relationships over time
Step 5 – Act & Iterate
Metrics only create value when action follows.
- Intervene when leading indicators deviate
- Test changes and optimize processes
- Learn from each cycle and refine targets
Best Practices for Tracking Indicators
Align Metrics to Your Strategic Objectives
- Tie every metric to a business goal
- Ensure leading metrics support lagging outcomes
- Create a clear strategy map
Limit Your Dashboard to Avoid Overwhelm
- Track 3–8 KPIs per performance level
- Avoid metrics that do not drive decisions
- Focus on actionable insights
Create a Balanced Scorecard Approach
- Financial perspective (lagging)
- Customer perspective (leading and lagging)
- Internal processes (leading)
- Learning and growth (leading)
Establish Correlation & Causation
- Test which leading indicators predict outcomes
- Use experiments and A/B testing
- Document validated relationships
Review & Adjust Regularly
- Review lagging metrics monthly or quarterly
- Monitor leading metrics continuously
- Update targets based on learning
Conclusion
Lagging indicators explain what has already happened, while leading indicators help predict what will happen next. Both are essential for effective performance measurement. Leading metrics guide daily actions, while lagging metrics validate long-term success. When used together, they create a continuous improvement loop that enables proactive decision-making and sustainable growth.
The most effective next step is to identify three leading and three lagging metrics tied to a key business goal, track them in a shared dashboard, and start analyzing how actions influence results over time.

Passionate about blogging and focused on elevating brand visibility through strategic SEO and digital marketing. Always tuned in to the latest trends, I’m dedicated to maximizing engagement and delivering measurable ROI in the dynamic world of digital marketing. Let’s connect and unlock new opportunities together!