


Sales teams can only improve what they measure, and sales analysis reports provide the structured data needed to refine every stage of the sales process. By turning raw numbers into insights, these reports help businesses uncover bottlenecks, improve forecasting, and systematically increase revenue. The focus of this blog is how to use sales analysis reports not just for tracking performance, but for actively optimizing the way leads move from first contact to closed deals.
What Are Sales Analysis Reports?
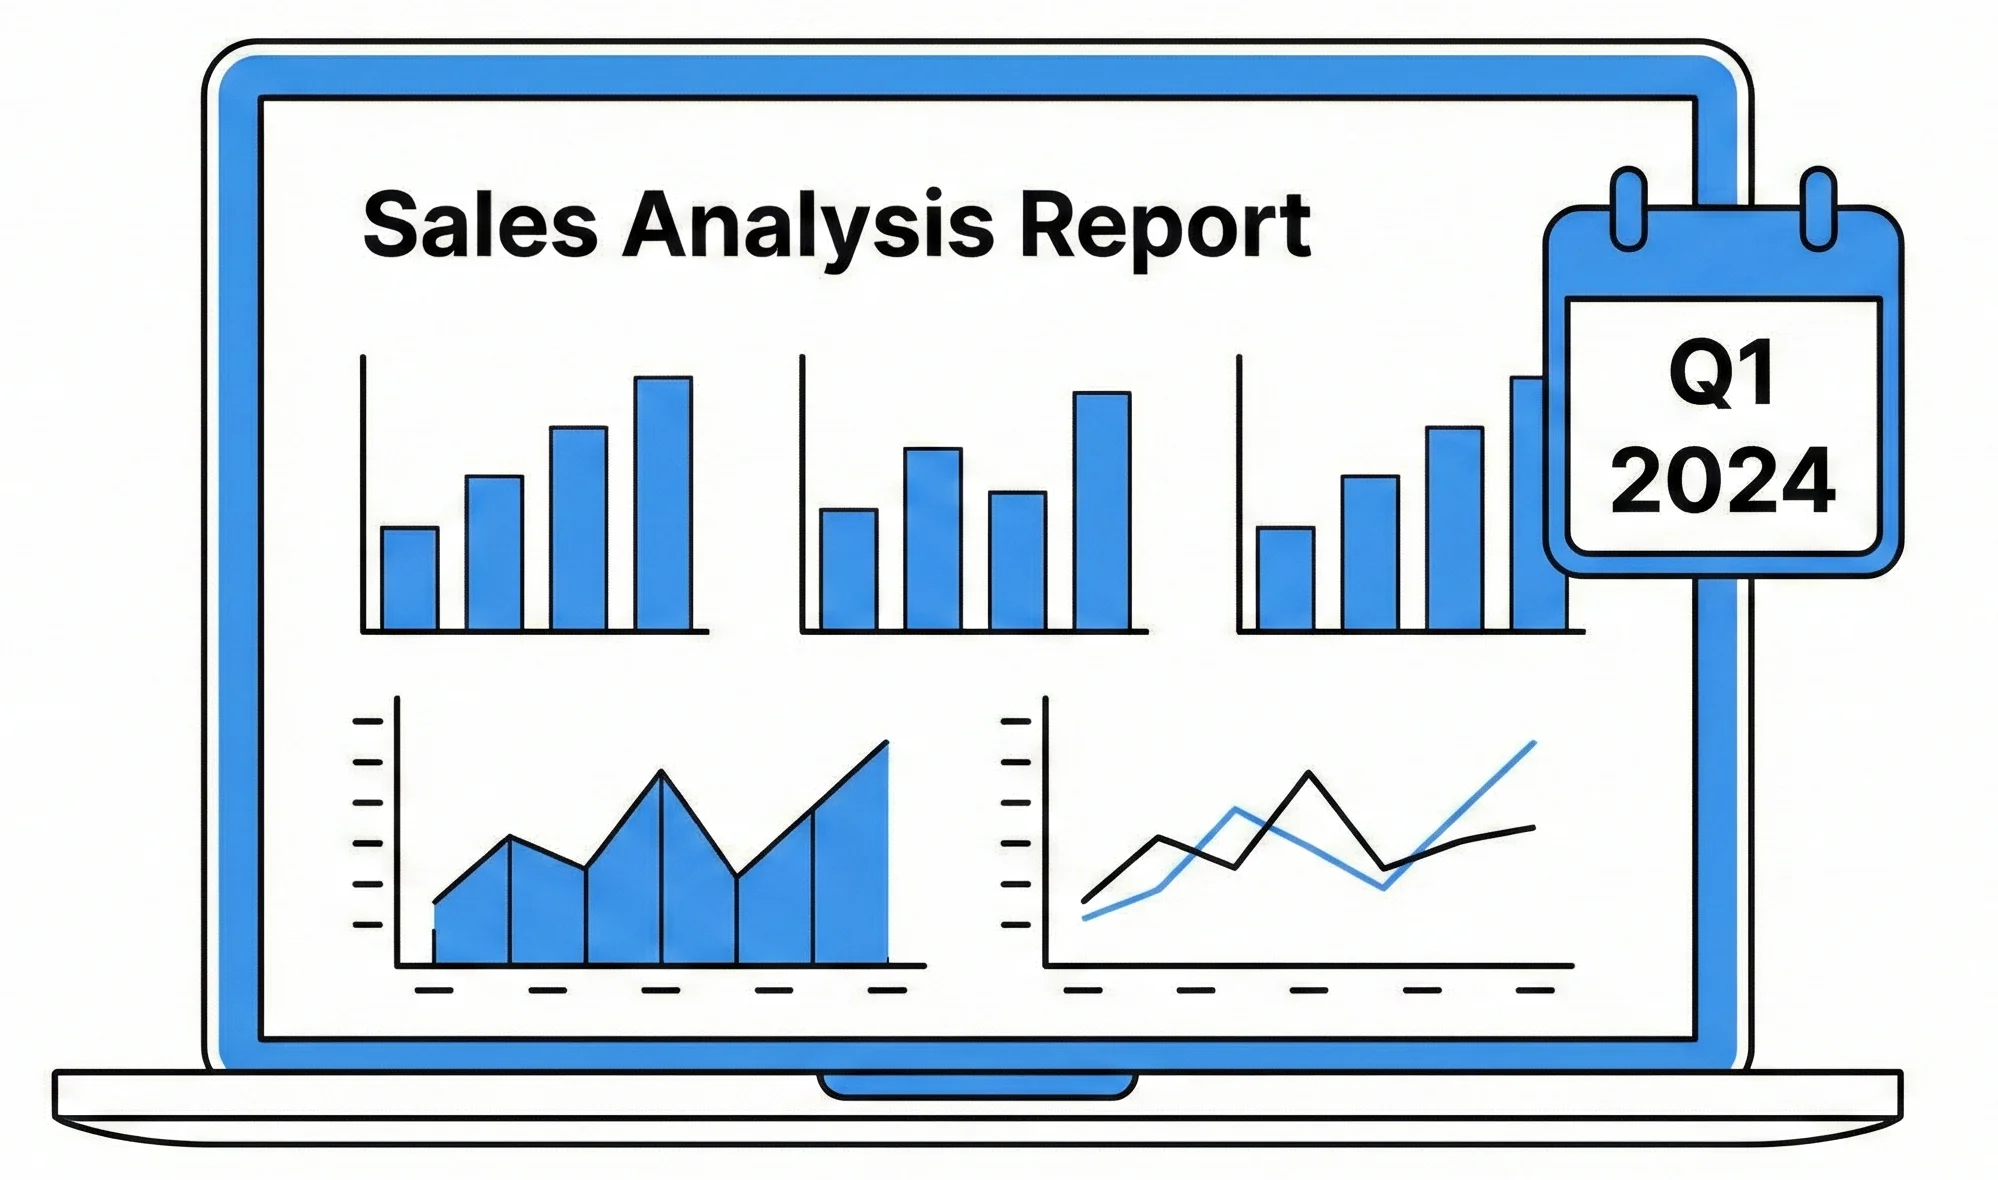
Sales analysis reports are structured documents or dashboards that compile and analyze sales data over a defined period to reveal performance, trends, and opportunities for improvement. Unlike simple “snapshot” reports that only show totals, sales analysis reports highlight how and why results occurred, often broken down by product, region, rep, channel, or customer segment. Their purpose is to turn data into actionable insight so leaders can adjust strategy, processes, and resources in ways that measurably improve outcomes.
These reports are useful for multiple stakeholders, including sales managers who need to coach teams, executives who must forecast and allocate budgets, and marketing teams that need feedback on lead quality and campaign performance. When consistently used, sales analysis reports create a data-driven culture where decisions are based on evidence rather than intuition.
Why Sales Analysis Reports Matter for Optimization
Sales analysis reports are central to optimization because they identify where the sales process is working and where it is leaking opportunities. By examining conversion rates, stage durations, and performance by rep or channel, businesses can pinpoint specific bottlenecks instead of guessing at root causes. This clarity enables more accurate forecasting and better planning, since leaders can see both current run rates and likely future outcomes.
These reports also support continuous improvement by revealing early signs of underperformance, such as lengthening sales cycles or falling win rates, before they significantly impact revenue. Over time, regularly reviewing analysis reports helps align strategy with actual buyer behavior and market changes, making the sales organization more adaptive and resilient.
Key Metrics & Data to Track in Sales Analysis Reports
A strong sales analysis report focuses on metrics that directly connect activity to outcomes rather than on vanity numbers. While exact metrics depend on the business model, several categories tend to be essential in most B2B and B2C environments.
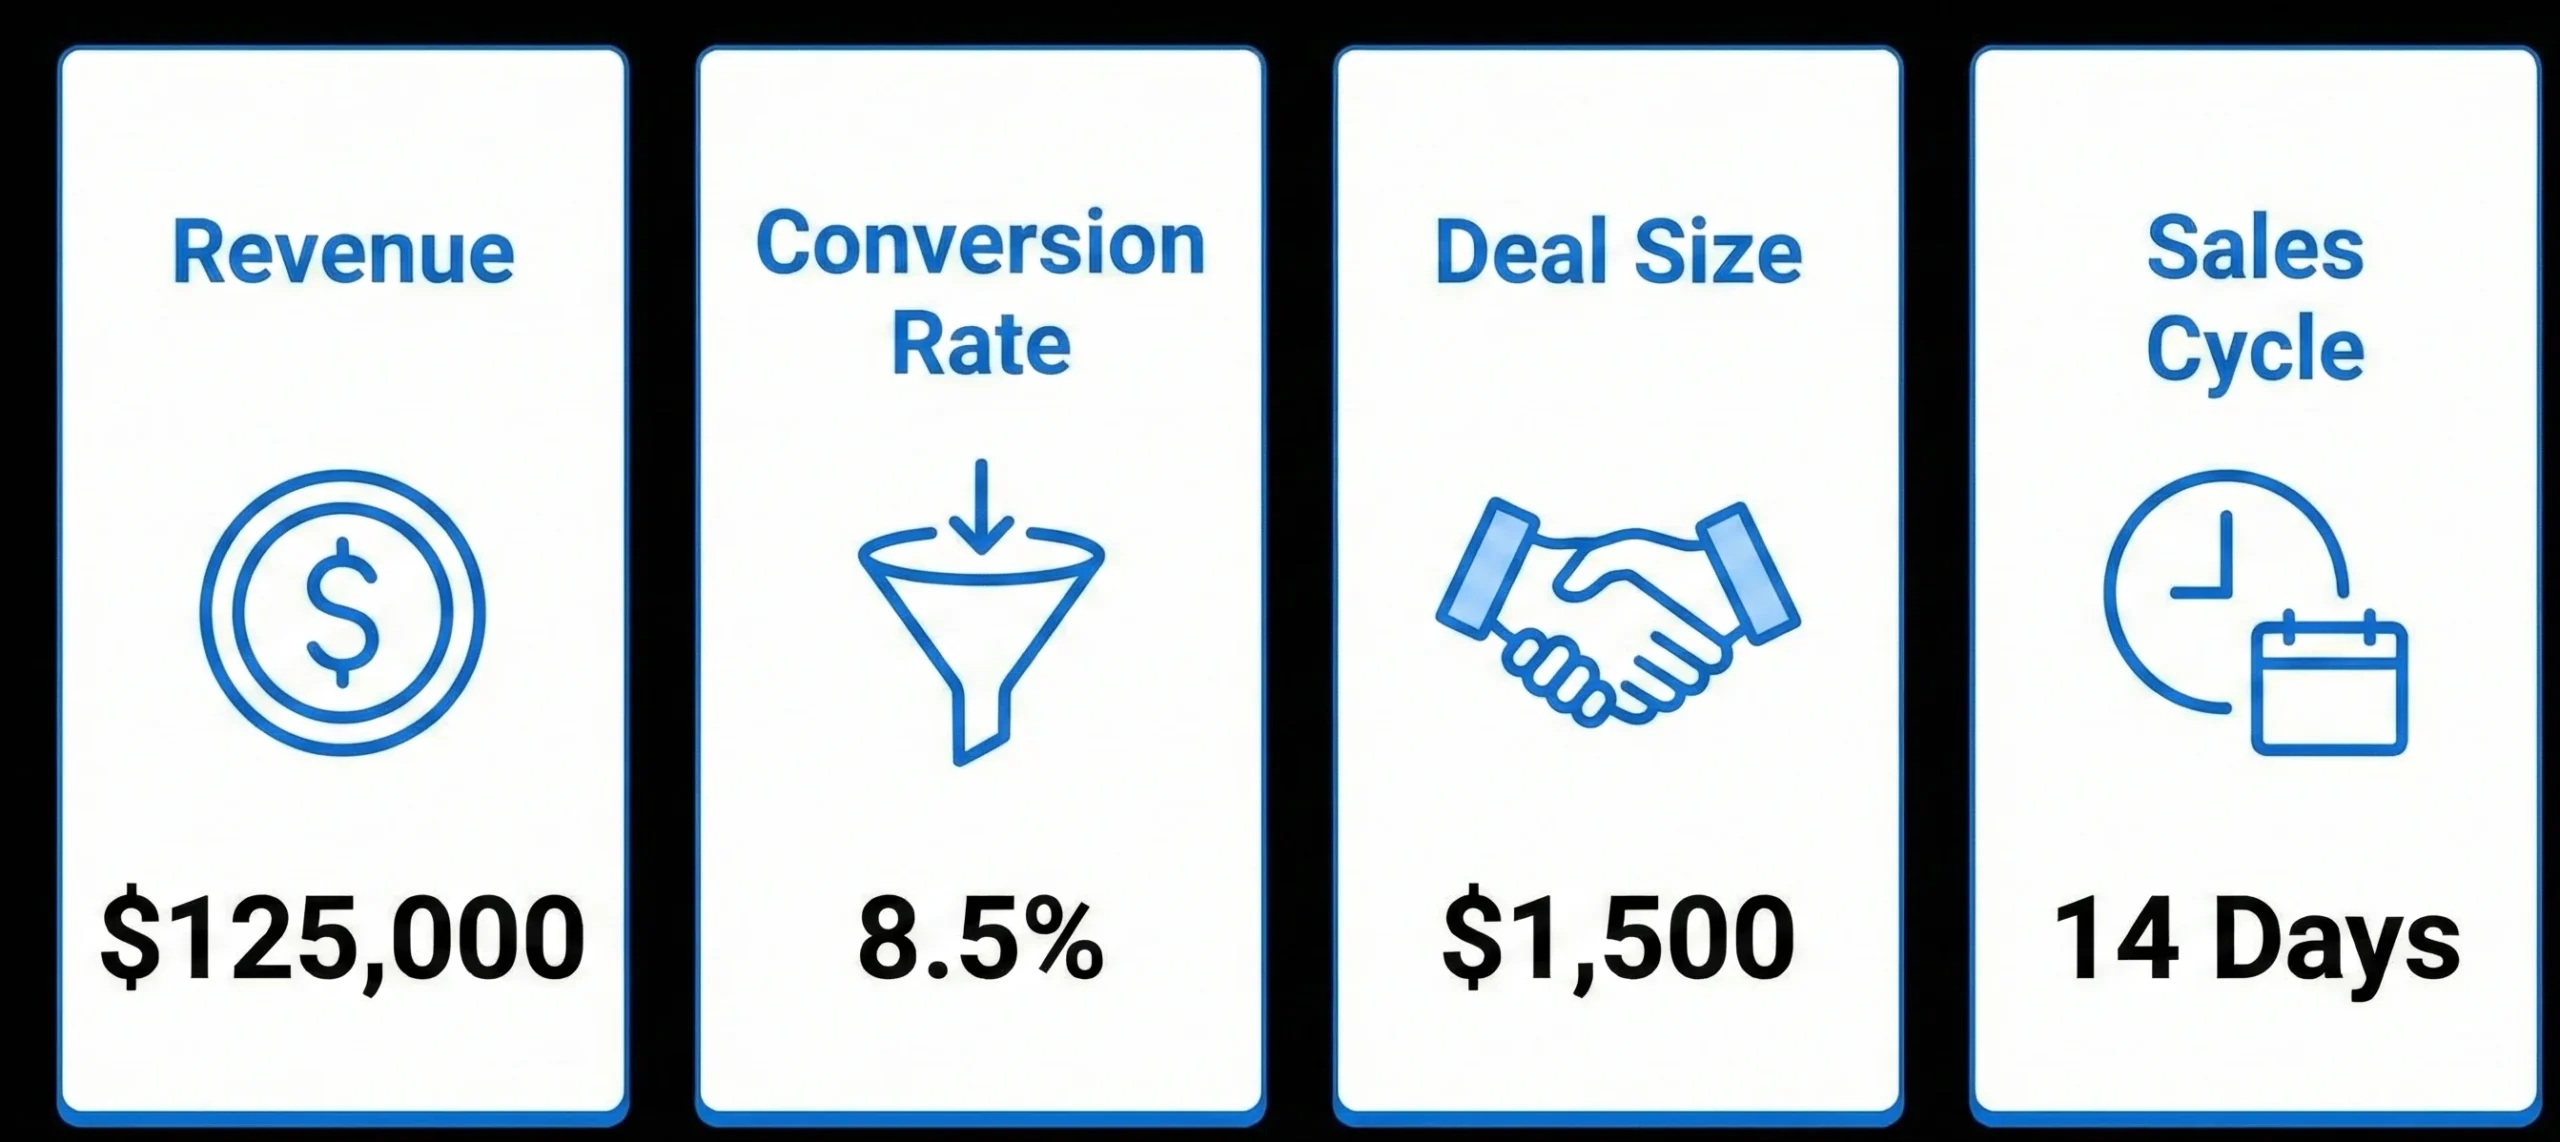
Revenue Metrics
- Total sales revenue over the selected period, often segmented by product, customer segment, or region to see where growth is coming from.
- Revenue growth rate compared to prior periods or the same period in previous years to understand trajectory.
- Average deal size, which helps with quota setting and forecasting, since it shows how many deals are needed to hit a target.
- Customer lifetime value (CLV) when data allows, showing how much revenue a typical customer is expected to generate over the relationship.
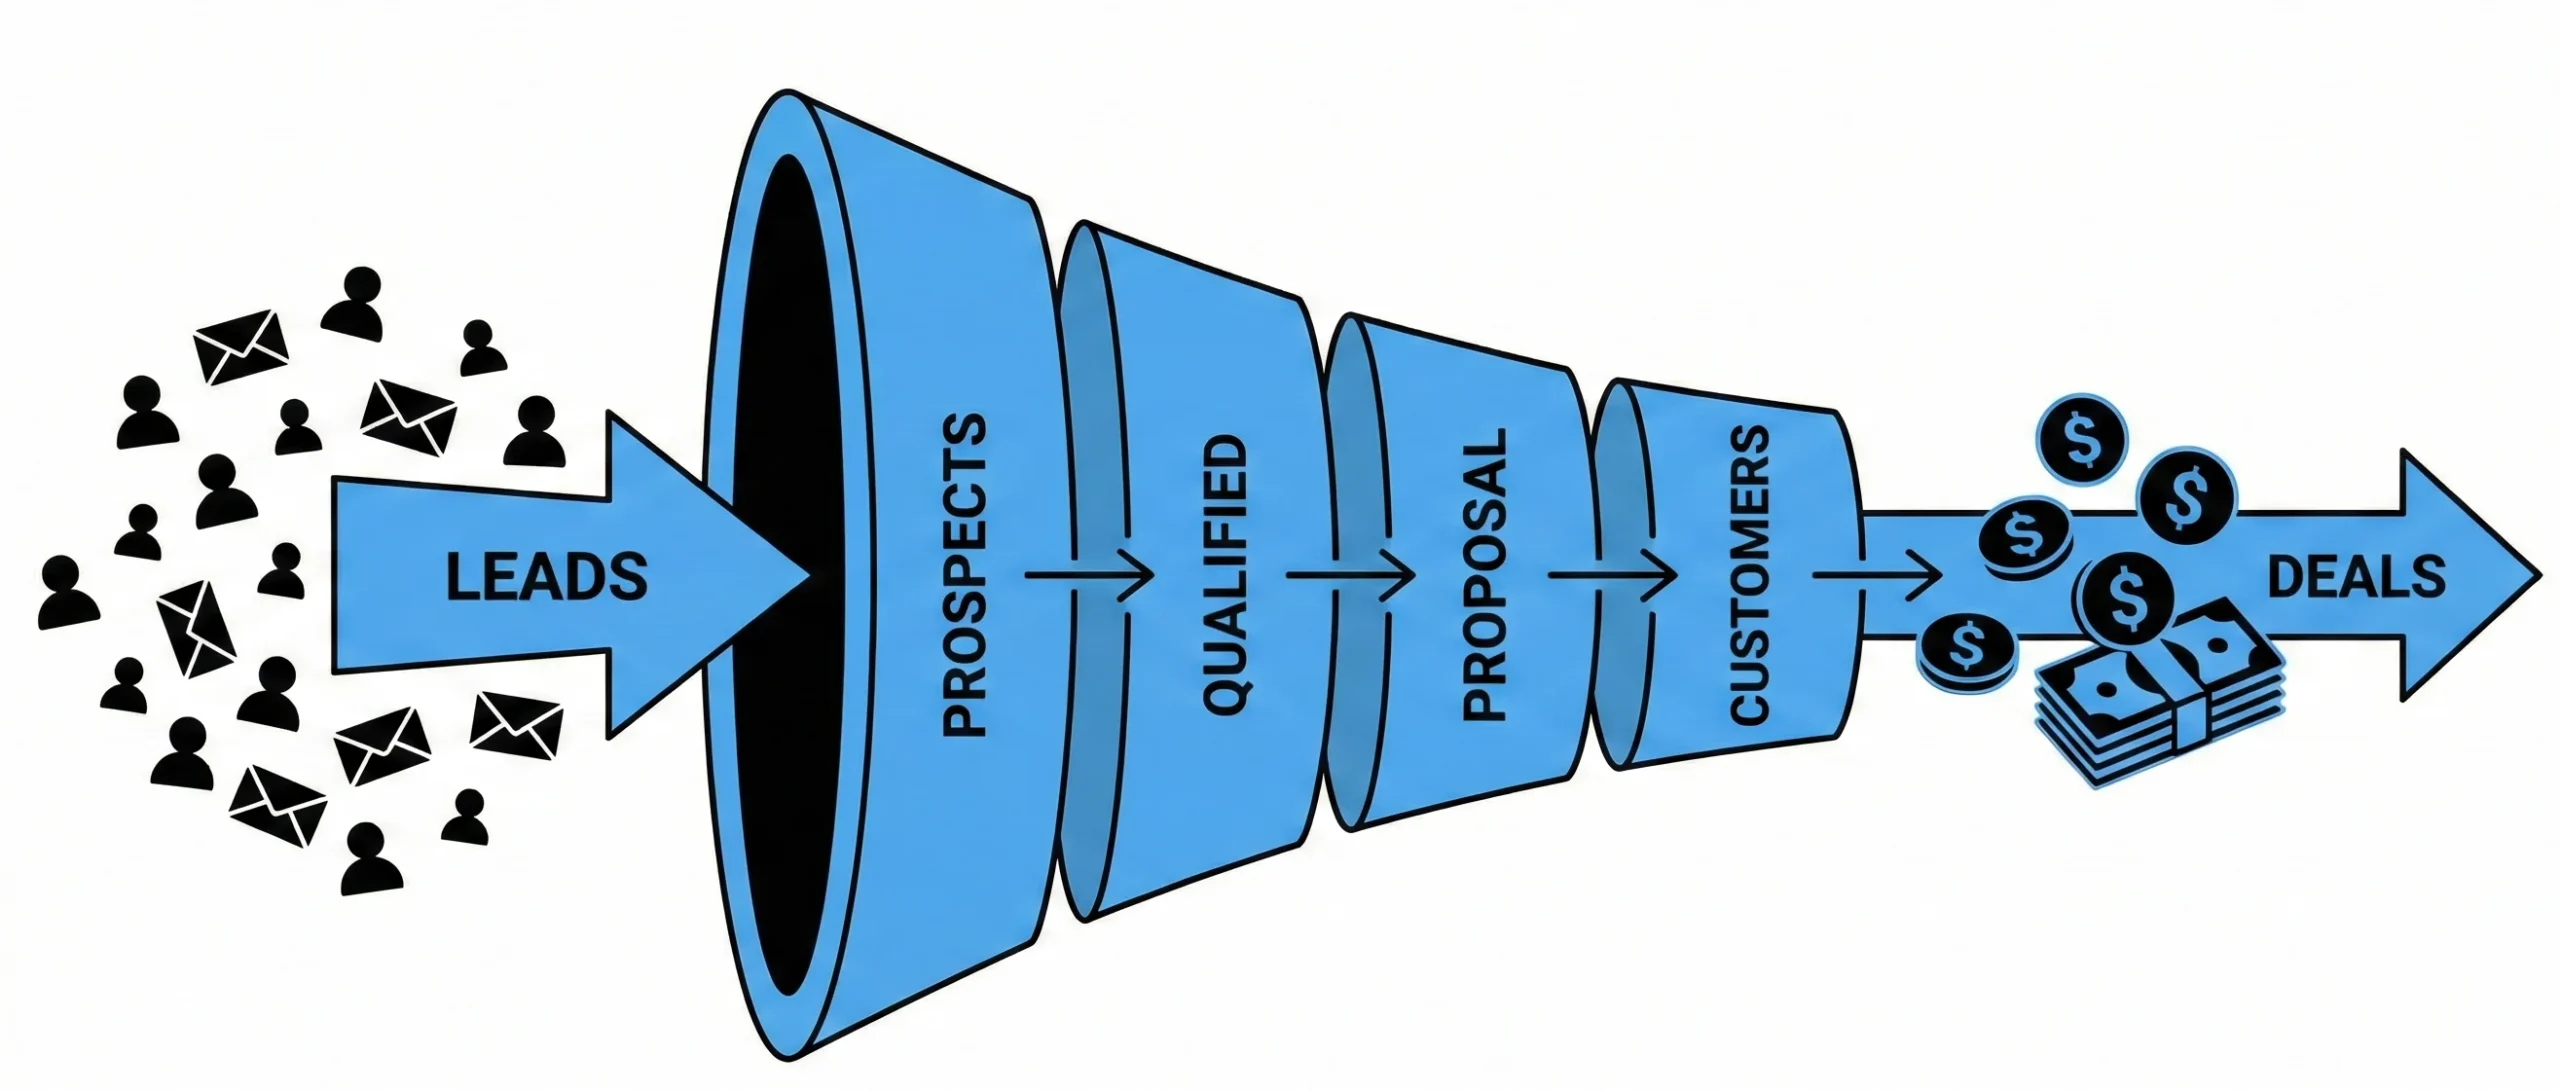
Pipeline Metrics
- Lead-to-opportunity conversion rate to measure how effectively raw leads are qualified into real pipeline.
- Opportunity-to-win (or stage-to-stage) conversion rates that reveal where prospects stall or drop out of the pipeline.
- Pipeline velocity, commonly calculated using deal count, average deal size, win rate, and sales cycle length, indicating how fast value moves through the funnel.
- Stage duration, or average time spent in each pipeline stage, which helps identify slow points in the process.
Performance Metrics
- Sales cycle length, defined as the average time from initial lead creation to closed-won deal, used to assess efficiency.
- Win rate or close rate, calculated as closed-won deals divided by total opportunities or proposals, used to gauge effectiveness.
- Customer acquisition cost (CAC), especially in subscription or high-velocity models, to understand how efficiently revenue is generated.
Activity Metrics
- Number of calls, emails, meetings, and demos per rep or per account over the period.
- Number of proposals or quotes sent, which often correlates with late-stage pipeline health.
- Lead response time, or “speed to lead,” which has been shown to strongly influence qualification and conversion rates.
The goal is not to track everything, but to prioritize metrics that are clearly linked to revenue and that can be influenced by changes in behavior, process, or strategy.
The Sales Process Optimization Framework
This section explains a practical framework for using sales analysis reports to systematically improve the sales process. Each step builds on the previous one, ensuring that reporting leads to concrete changes rather than static dashboards.
Step 1: Define Clear Objectives
The first step is to define what needs to be improved, such as increasing win rate, shortening the sales cycle, or improving conversion from marketing-qualified leads (MQLs) to opportunities. Clear objectives determine which metrics matter and which cuts of data should be prioritized in reports. For example, if the objective is to reduce churn in a subscription business, reports must highlight renewal rates, expansion revenue, and reasons for cancellations.
Step 2: Collect & Organize Sales Data
Accurate reporting depends on clean, centralized data, which is why most organizations rely on a CRM as the primary source of truth. Ensuring that all reps log activities, update deal stages, and maintain accurate contact records is essential to avoid misleading conclusions. Timeframes should also be defined up front, such as daily for productivity tracking, weekly for pipeline health, or monthly and quarterly for strategic performance.
Step 3: Analyze Your Data
Once data is collected, analysis typically starts with comparisons: current period vs. previous period, or vs. the same period last year, to detect trends. Segmenting by rep, region, product line, or channel helps identify where outliers exist, both positive and negative. Benchmarking against historical performance or available external benchmarks gives additional context for whether current numbers are strong or weak.
Step 4: Identify Key Insights & Gaps
The purpose of analysis is to surface specific, evidence-based insights such as “conversion between demo and proposal dropped significantly this quarter” or “deals in stage 2 are now taking twice as long as last year.” These observations help pinpoint gaps like insufficient qualification, misaligned messaging, or capacity constraints in later-stage activities. Insights should always be tied to metrics and examples from the data, not anecdotal impressions.
Step 5: Create Actionable Recommendations
Each insight should be followed by a recommendation that is specific, measurable, and time-bound, such as introducing a new discovery call checklist to improve qualification or revising pricing guidelines for deals in a specific segment. Recommendations may include coaching for underperforming reps, new enablement content, process changes, or adjustments in target segments or channels. The goal is to directly link what the data shows to what the team will do differently.
Step 6: Implement & Measure Results
After changes are implemented, the same reports should be used to track whether key metrics improve over subsequent periods. For example, if the aim was to reduce sales cycle length, later reports should show changes in average and median cycle times across reps and segments. This feedback loop ensures that optimization efforts are grounded in measurable outcomes rather than one-time initiatives.
Also Read: Guide to Sales Commission Structures: Types, Examples, and Benefits
10 Critical Sales Analysis Report Types for Optimization
Different report types serve different optimization purposes, and using a mix of them provides a rounded view of performance. The ten types below are widely used as foundational building blocks for modern sales reporting.
1. Sales Pipeline Report
A sales pipeline report visualizes all open opportunities by stage, value, and expected close date, giving an overview of pipeline health. It helps leaders see whether there is enough value in each stage to hit targets and where deals tend to stall. Optimization actions from this report might include rebalancing rep workloads, revising definitions for each stage, or adjusting prospecting activity if early-stage volume is low.
2. Conversion Rate Report
Conversion rate reports track the percentage of leads that progress from one stage to another, such as lead-to-opportunity, opportunity-to-demo, or proposal-to-closed-won. These reports reveal which stages are most fragile and which tactics or reps are achieving better results. Teams can use this insight to standardize best-performing behaviors, refine qualification criteria, or adjust messaging at specific stages.
3. Average Deal Size Report
An average deal size report calculates the mean or median value of closed-won deals in a period, sometimes broken down by segment, product, or channel. This metric helps in quota design, revenue forecasting, and evaluating whether the team is successfully moving upmarket or expanding cross-sell and upsell. If average deal size is shrinking, leaders might investigate discounting practices, product mix, or whether reps are failing to promote higher-value packages.
4. Sales Cycle Length Report
This report shows how long deals take from first contact or lead creation to closed-won, often segmented by rep, deal size, or segment. Longer cycles can increase risk and cost, while very short cycles might indicate inadequate qualification or underpricing. By comparing cycle length across top and average performers, teams can uncover process differences that shorten time-to-close.
5. Lead Response Time Report
Lead response time reports measure how quickly reps follow up with new inbound leads or key handoffs, often in minutes or hours. Faster responses tend to increase connection and qualification rates, especially for high-intent inbound leads. Monitoring this metric helps teams adjust routing, staffing, or automation so important leads are contacted promptly.
6. Won vs. Lost Deals Analysis Report
Won vs. lost reports analyze closed opportunities to understand why deals were won and why they were lost, usually including reasons, competitors, and pricing or feature factors. These insights can influence product roadmap, pricing strategy, competitive positioning, and training materials. Over time, patterns like frequent losses to a specific competitor or repeated objections about a missing capability inform both sales and product strategy.
7. Customer Churn Report
For subscription or repeat-purchase models, churn reports track which customers have canceled or stopped buying, along with timing, value, and reasons where available. High churn may indicate product issues, poor onboarding, misaligned expectations, or competitive pressure. By linking churn to acquisition channels, segments, or usage patterns, teams can refine targeting and post-sale engagement strategies.
8. Marketing Collateral and Channel Usage Report
These reports connect sales outcomes to marketing touchpoints, showing which channels (such as search, email, events, or social) and which assets (like case studies or demos) correlate with higher conversion and revenue. They enable both sales and marketing to double down on effective campaigns and deprioritize underperforming ones. This alignment helps ensure that content and campaigns are optimized not just for leads, but for closed business.
9. Sales Performance Report (Rep-Level)
Rep-level performance reports aggregate metrics such as quota attainment, win rate, average deal size, activity volume, and cycle length by individual. These reports support fair evaluation, highlight top performers, and surface reps who may need targeted coaching. They also help identify which selling behaviors and approaches are associated with better results, enabling more effective enablement.
10. Revenue Report
Revenue reports focus on total and segmented revenue, often broken down by new business, renewals, and expansions, as well as by product, region, or segment. They connect sales activity to overall business performance and are often used for executive reviews, budgeting, and forecasting. When reviewed alongside pipeline and performance reports, revenue reports help verify whether current strategies are translating into sustainable growth.
Best Practices for Creating Effective Sales Analysis Reports

Effective sales analysis reports are purpose-built, accurate, and easy to interpret for their intended audience. The following practices help ensure they drive decisions instead of just documenting activity:
- Start with a clearly defined objective and audience so the report shows only the data needed for specific decisions.
- Maintain strong CRM hygiene by enforcing consistent data entry, stage definitions, and required fields across the team.
- Use visual elements such as charts, graphs, and color-coding to highlight trends, outliers, and variances at a glance.
- Include historical comparisons and trend lines to distinguish one-off fluctuations from meaningful shifts.
- Segment data by rep, region, product, or channel to discover patterns that averages can hide.
- Focus on a concise set of key performance indicators rather than trying to show every possible metric.
- Establish reporting cadences aligned with use cases, such as weekly pipeline reviews and monthly executive summaries.
- Conclude reports with a short list of recommended actions so data naturally flows into decision-making.
Tools & Technologies to Streamline Sales Analysis

Modern sales teams rely on a combination of CRM systems, analytics platforms, and reporting tools to automate and enhance sales analysis. These technologies reduce manual data manipulation and make insights more accessible across the organization.
- CRM platforms such as Salesforce, HubSpot, Zoho, and similar systems act as the primary repositories for account, contact, opportunity, and activity data.
- Business intelligence tools like Tableau, Power BI, and Databox help create interactive dashboards and visualizations on top of CRM or data warehouse sources.
- Revenue operations and analytics platforms integrate marketing and sales data to produce unified, customizable reports.
- Many tools now offer out-of-the-box templates for common sales reports, reducing setup time and encouraging consistent usage across teams.
Common Mistakes to Avoid When Using Sales Analysis Reports
Even with good tools, certain mistakes can limit the value of sales analysis reports. Awareness of these pitfalls helps teams design processes that consistently produce actionable insights.
- Tracking too many metrics leads to analysis paralysis and makes it difficult to see which numbers really matter.
- Allowing poor data hygiene results in inaccurate or misleading reports, undermining trust and decision quality.
- Creating reports without a clear purpose or audience causes information overload and low adoption.
- Failing to turn insights into concrete actions means reports become a passive record rather than a driver of improvement.
- Ignoring historical comparisons makes it hard to distinguish normal variability from significant changes.
- Overemphasizing activity metrics at the expense of revenue and outcome metrics can lead to “busy” behavior that does not translate into growth.
Implementing Sales Analysis Reports: Step-by-Step Action Plan
A structured rollout plan helps teams adopt sales analysis reports in a manageable, results-focused way. The following phased approach provides a practical path:
- Week 1: Define objectives, stakeholders, and the core metrics to track, and document stage definitions and data standards.
- Week 2: Audit CRM data quality, fill obvious gaps, and set up initial dashboards or report templates tied to objectives.
- Week 3: Generate the first full set of reports, review them with key stakeholders, and identify a small number of priority insights.
- Week 4: Translate insights into specific changes, such as new qualification rules or revised follow-up SLAs, and assign owners and timelines.
- Ongoing: Review reports regularly at agreed cadences, track the impact of changes, and refine metrics and visualizations as needs evolve.
Conclusion
Sales analysis reports transform scattered sales data into a focused view of performance, enabling teams to identify bottlenecks, refine strategies, and forecast more accurately. When tied to clear objectives and used within a structured optimization framework, these reports help organizations continuously adjust their sales process in response to real-world results and market shifts. By focusing on meaningful metrics, leveraging the right tools, and converting insights into action, businesses can use sales analysis reports to systematically improve their sales outcomes over time.

Passionate about blogging and focused on elevating brand visibility through strategic SEO and digital marketing. Always tuned in to the latest trends, I’m dedicated to maximizing engagement and delivering measurable ROI in the dynamic world of digital marketing. Let’s connect and unlock new opportunities together!