


A slow website is one of the fastest ways to lose visitors. Nothing frustrates users more than waiting for a page to load. In fact, a few seconds of delay can cause people to bounce, abandon carts, or simply choose a competitor.

From an SEO perspective, slow-loading pages also hurt your search rankings. Google has made it clear: site speed is a ranking factor. Pages that load faster are more likely to appear higher in search results because they offer a better user experience.
That’s where Google PageSpeed Insights (PSI) comes in. It’s a free tool that analyzes your web pages, scores them on performance, and provides clear recommendations to improve loading times.
In this guide, we’ll break down everything you need to know about PageSpeed Insights — what it measures, how to interpret the report, and how to use its recommendations to make your site lightning fast.
What Is Page Speed?
Page speed refers to how quickly a webpage loads and becomes usable for visitors. Google defines it in two key ways:
- Time to display content above the fold – how long it takes for visible content (like text or images) to appear.
- Time to fully render the page – how long before the entire page (scripts, images, stylesheets) is loaded and interactive.
Factors affecting page speed:
- Outside your control:
- User’s internet connection.
- Device performance.
- ISP or mobile network speed.
- Within your control (most important):
- Heavy images or uncompressed videos.
- Poor server/hosting performance.
- Bloated themes or plugins.
- Excessive redirects.
- Inefficient JavaScript and CSS files.
Why does this matter? Because Google rewards fast websites. A quick-loading page not only delights users but also signals to Google that your site provides a high-quality experience.
What Is Google PageSpeed Insights (PSI)?
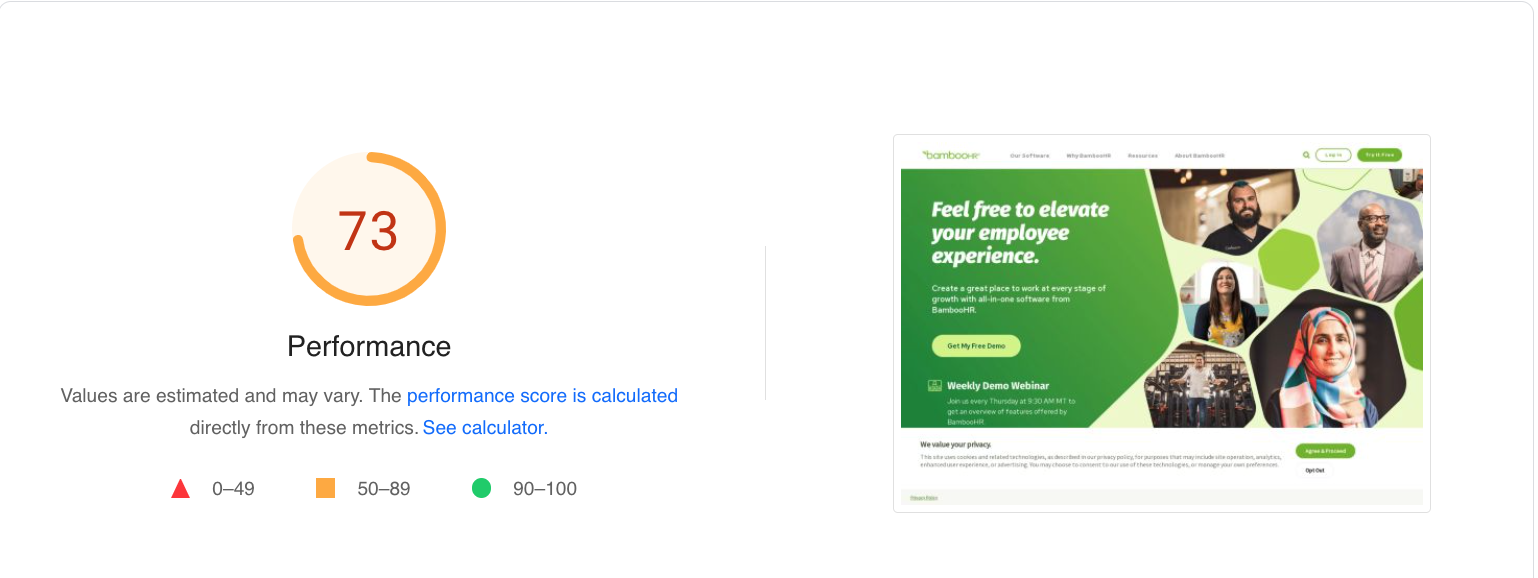
PageSpeed Insights is a free tool by Google that evaluates both desktop and mobile versions of a webpage.
What PSI does:
- Analyzes a page’s performance using real-world user data (field data) and lab simulations (lab data).
- Generates a score out of 100 for performance.
- Highlights issues slowing down your site.
- Provides clear opportunities and diagnostics for improvement.
Why is PSI so valuable? While there are other tools (GTMetrix, Pingdom, WebPageTest), PSI is directly tied to Google’s search engine standards. If you want to improve SEO performance, this is the most relevant tool.
PageSpeed Insights and SEO Rankings
One common misconception is that PSI scores directly affect SEO rankings. They don’t. Google has confirmed this.
Instead:
- The PSI score is a guide — an estimated performance snapshot.
- The metrics behind the score, like Core Web Vitals, are what matter for rankings.
Core Web Vitals and SEO:
- Largest Contentful Paint (LCP): Measures loading performance. Aim for <2.5 seconds.
- First Input Delay (FID): Measures interactivity. Aim for <100ms.
- Cumulative Layout Shift (CLS): Measures visual stability. Aim for <0.1.
Google considers these as part of its ranking algorithm. So, while your exact PSI score doesn’t matter, improving the underlying metrics does.
Bottom line: Faster sites = better rankings and happier users.
Page Speed and User Experience
Speed isn’t just about SEO — it’s about user satisfaction and conversions.
- A 1–3 second delay increases the chance of a bounce by 32%.
- Each additional second drops conversions by an average of 4.42%.
- On mobile, speed is the #1 priority — more important than design or content in keeping users engaged.
For example: imagine an e-commerce store. If the checkout page takes 5 seconds to load, users will likely abandon carts. But if it loads instantly, the purchase process feels smooth, increasing revenue.
Improving speed is non-negotiable. It directly impacts SEO + UX + conversions.
Using the PageSpeed Insights Tool
Getting started with PSI is simple:
- Go to PageSpeed Insights.
- Enter any URL you want to test.
- Click Analyze.
- Wait for the report.
What happens behind the scenes?
- Field Data (Real-world performance):
- Comes from Chrome User Experience Report (CrUX).
- Shows how actual users experience your page.
- Lab Data (Simulated environment):
- Uses Lighthouse API.
- Runs tests on mid-tier devices and 3G/4G networks.
- Helps eliminate external variables.
Together, this gives a complete picture of your page’s performance.
Understanding the PSI Report
The PSI report is color-coded for clarity:
- Green = Good.
- Yellow = Needs improvement.
- Red = Poor.
Let’s break down each section.
1. Core Web Vitals (Field Data)
These are the real-world metrics from CrUX:
- First Contentful Paint (FCP): Time for first text/image to load.
- Largest Contentful Paint (LCP): Time for main content (largest element) to load.
- First Input Delay (FID): Time until the page responds to the first click/interaction.
- Cumulative Layout Shift (CLS): Measures visual stability (e.g., if a button shifts when clicked).
Good thresholds:
- FCP: <1.8s
- LCP: <2.5s
- FID: <100ms
- CLS: <0.1
Example: If your CLS is high, users may accidentally click the wrong button (frustrating!).
2. Lab Data (Lighthouse Metrics)
Synthetic metrics tested in a controlled environment:
- Speed Index: How quickly visible content appears.
- Time to Interactive: When the page becomes fully usable.
- Total Blocking Time: Delays between FCP and interactivity.
Lab Data is especially useful when your site is new or doesn’t have enough field data yet.
3. Opportunities & Diagnostics
This is the most actionable part of the report.
- Opportunities: Specific issues slowing your site, with estimated time savings.
- Example: “Compress images to save 1.2s.”
- Diagnostics: Best practices your site isn’t following.
- Example: “Avoid long main-thread tasks.”
Each comes with dropdowns that explain the issue and how to fix it.
These sections tell you exactly where to start.
4. Passed Audits
This section lists everything your page is already doing well.
- A long list = good sign.
- Example: Efficiently serving images, using HTTPS, enabling compression.
Passed audits show you’re on the right track.
After the PSI Report: 6 Tips to Improve Page Speed
Once you have your report, the next step is implementation. Here are six universal fixes:
1. Optimize Your Images
- Resize and compress.
- Use modern formats (WebP, AVIF).
- Set height/width attributes to avoid layout shifts.
- Deliver via CDN.
2. Embed Videos Instead of Hosting
- Don’t upload heavy video files to your server.
- Use YouTube or Vimeo and embed them.
- Reduces server load and speeds up pages.
3. Avoid Excessive Redirects
- Redirect chains = wasted loading time.
- Example: A → B → C should be A → C.
- Fewer redirects = faster TTFB (time to first byte).
4. Choose a Fast Website Theme
- Lightweight, mobile-first themes improve PSI scores.
- For WordPress, themes like GeneratePress, Astra, or Neve are optimized for speed.
5. Use Asynchronous Loading for JavaScript
- Synchronous: Browser pauses everything to load JS.
- Asynchronous: Browser loads JS while still rendering page.
- This reduces “blocking” and makes pages interactive faster.
6. Enable Browser Caching
- Store static files (images, CSS, JS) on user’s device.
- Next visit = faster load.
- Configure via .htaccess file or plugins.
Conclusion
Google PageSpeed Insights is more than just a score. It’s a roadmap to faster, more user-friendly websites.
- The tool highlights exactly where your site slows down.
- The recommendations guide developers and marketers step by step.
- Implementing fixes leads to higher rankings, happier users, and better conversions.
Remember: speed isn’t just a technical detail — it’s a core part of user experience and SEO. If you take action on your PSI report today, you’ll be one step closer to outperforming your competitors in search.

An avid blogger, dedicated to boosting brand presence, optimizing SEO, and delivering results in digital marketing. With a keen eye for trends, he’s committed to driving engagement and ROI in the ever-evolving digital landscape. Let’s connect and explore digital possibilities together.