


Picture this. You just spent $10,000 on Facebook ads last month and pulled in $40,000 in sales. Sounds great, right? But then your business partner asks “so was it actually worth it after everything else we spent?” and suddenly you’re not so sure anymore. That gap between “we made money” and “we actually know if this campaign worked” is exactly where ROAS lives.

Return on Ad Spend isn’t some fancy metric invented to make marketing sound more scientific than it is. It’s the number that tells you, in the most direct way possible, whether the money you put into an ad campaign came back to you, and how much. No fluff, no vague brand-awareness talk. Just revenue divided by spend. But here’s the catch — knowing the formula is the easy part. Knowing what to actually do with that number, and when it’s lying to you by omission, that’s where most people trip up.
Marketers use it. Agencies live and die by it when reporting to clients. Business owners running their first ad campaign need it just as much as someone managing a seven-figure ad budget. Basically, if you’re spending money to get in front of people and expecting something back, ROAS is the metric that keeps you honest.
This guide breaks it all down properly. Not in a dry, textbook way, but the way someone who’s actually managed real ad budgets and made real mistakes would explain it.
What You Will Learn in This Guide
- What ROAS actually means and how it’s different from ROI
- The exact formula, with real numbers so it actually sticks
- What counts as a “good” ROAS across different industries
- The factors that quietly push your ROAS up or down
- Where ROAS falls short and why it shouldn’t be your only metric
- Practical ways to actually improve your ROAS, not vague “optimize better” advice
- Answers to the questions people actually search for around ROAS
Let’s get into it.
What Is ROAS?
This is the core question, and honestly, most people get a rough idea right but miss the nuance that actually matters when they’re making budget decisions.
ROAS Definition
ROAS stands for Return on Ad Spend. In plain terms, it tells you how much revenue you generated for every dollar you spent on advertising. If you spent $1,000 and made $5,000 back in sales directly attributable to that spend, your ROAS is 5:1, or sometimes just written as 5. Some platforms show it as a ratio, others as a multiplier, others as a percentage. Same math, different labels.
How ROAS Measures Advertising Effectiveness
Here’s the thing people miss. ROAS isn’t measuring whether your business is profitable. It’s measuring whether the ad spend itself generated revenue. Those sound similar but they’re not the same conversation. A campaign can have a fantastic ROAS and still lose you money once you factor in product costs, shipping, returns, and everything else that eats into margin before it ever hits your bank account. ROAS tells you the ad worked in isolation — nothing more, nothing less.
Why ROAS Is Important
Measuring campaign profitability. Well, sort of. ROAS gives you a surface-level read on whether the campaign generated more money than it cost, which is the first checkpoint before you even think about true profitability.
Evaluating marketing performance. When you’re running five different campaigns across three platforms, ROAS gives you a quick way to rank them against each other. The one pulling a 6:1 is clearly doing something the one stuck at 1.5:1 isn’t.
Budget allocation. Once you know which campaigns perform best, you shift dollars toward them. That’s basically the whole game in paid advertising — find what works, feed it more money, kill what doesn’t.
Improving decision-making. Instead of guessing which platform or audience segment is “probably working better,” ROAS gives you an actual number to argue with, or defend, in front of a boss or client.
Where ROAS Is Used
ROAS shows up pretty much everywhere paid advertising happens, though how it’s calculated and reported can shift slightly platform to platform:
- Google Ads — tracked through conversion values tied to Google Analytics or direct conversion tracking.
- Meta Ads — Facebook and Instagram report ROAS directly in Ads Manager, pulling from pixel-tracked purchase events.
- LinkedIn Ads — less common here since LinkedIn skews toward lead gen, but still used for companies running direct-response campaigns.
- TikTok Ads — increasingly tracked as TikTok Shop and e-commerce integrations have grown.
- Amazon Ads — ACoS (Advertising Cost of Sale) is basically the inverse of ROAS, and Amazon sellers watch this obsessively.
- E-commerce campaigns — probably the single most common place ROAS gets used, since revenue attribution is usually cleaner here than in service-based businesses.
How to Calculate ROAS
The math itself is refreshingly simple. It’s the inputs that get messy.
ROAS Formula
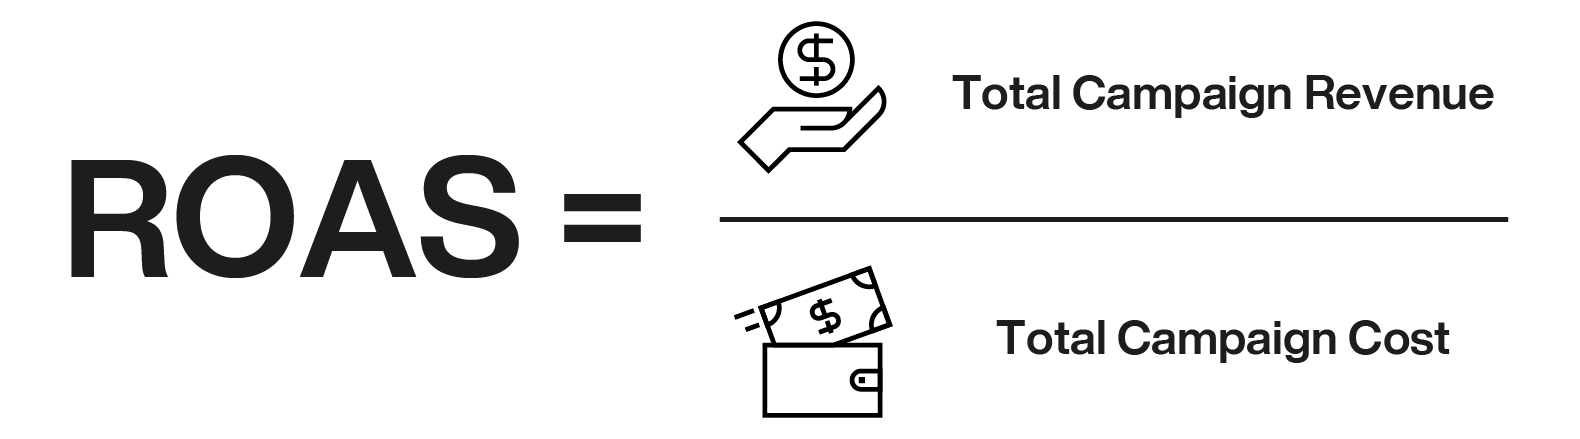
ROAS = Revenue from Ads ÷ Cost of Ads
That’s the whole formula. No hidden multipliers, no percentage conversions required (though you can express it as a percentage if you want — just multiply by 100).
Step-by-Step Calculation
Say you spent $2,000 on a Meta campaign and it generated $8,000 in tracked sales. Here’s how it breaks down:
- Take your revenue: $8,000
- Divide by your ad spend: $8,000 ÷ $2,000 = 4
- Your ROAS is 4, or 4:1, meaning for every dollar spent, you made four back.
ROAS Calculation Example
Let’s run a couple more so the math actually sticks in your head:
- Spend $500, generate $2,500 in sales. ROAS = $2,500 ÷ $500 = 5.
- Spend $15,000, generate $30,000 in sales. ROAS = $30,000 ÷ $15,000 = 2.
- Spend $100, generate $150 in sales. ROAS = $150 ÷ $100 = 1.5.
Notice that last one. A 1.5 ROAS means you made a dollar fifty for every dollar spent — sounds okay until you remember that number doesn’t include the cost of the product, shipping, payment processing fees, or your own time. That 1.5 could easily be a loss once everything else is accounted for.
How to Interpret Your ROAS Results
A ROAS of 1 means you broke even on ad spend alone — you got back exactly what you put in, with zero left over for product cost or overhead. Anything below 1 means the campaign lost money outright, no interpretation needed there. Above 1 starts looking better, but “good” depends heavily on your margins. A business with 80% margins can be comfortable at a 2:1 ROAS. A business with razor-thin 15% margins might need a 6:1 or 7:1 just to break even once everything else is factored in.
Common ROAS Calculation Mistakes
- Using all-time revenue instead of ad-attributed revenue. People sometimes throw in total store revenue instead of isolating what actually came from the ad campaign, which massively inflates the number.
- Ignoring attribution windows. Meta and Google let you pick attribution windows (1-day click, 7-day click, 28-day view, etc.), and picking a generous window can make your ROAS look way better than it actually performs in reality.
- Forgetting returns and refunds. If a customer buys something through your ad and returns it two weeks later, that revenue often stays counted in your ROAS unless you’re actively adjusting for it.
- Mixing blended ROAS with platform-reported ROAS. Blended ROAS looks at total revenue against total ad spend across all channels. Platform-reported ROAS only reflects what that specific platform claims credit for. These numbers are almost never the same, and confusing them leads to bad budget decisions.
Why Does ROAS Matter?
Beyond the basic definition, here’s why this metric actually earns its spot as one of the most-watched numbers in paid advertising.
Measures Advertising Efficiency
ROAS tells you, dollar for dollar, how efficiently your ad spend converts into revenue. Two campaigns can have the exact same total spend and totally different ROAS depending on targeting, creative, and offer — efficiency is the whole story here.
Helps Optimize Marketing Budget
Once you see which campaigns, audiences, or platforms deliver the strongest ROAS, reallocating budget becomes a lot less like guesswork and a lot more like just following the data.
Identifies High-Performing Campaigns
Running ten ad sets at once? ROAS quickly separates the ones actually pulling their weight from the ones quietly wasting budget while looking fine on the surface with decent CTR numbers.
Improves Revenue Growth
When you consistently feed budget into your highest ROAS campaigns and cut the underperformers, your overall revenue from ads compounds over time instead of staying flat.
Supports Better Business Decisions
Beyond just ad optimization, ROAS data feeds into bigger decisions — should you expand into a new platform, should you increase overall ad budget, should you launch a new product line based on how well similar products have performed in paid campaigns.
What Is a Good ROAS?
Everyone wants a single number answer here, and honestly, there isn’t one. It depends entirely on your margins, industry, and business model.
Average ROAS Benchmarks by Industry
| Industry | Typical “Good” ROAS |
|---|---|
| E-commerce (general) | 4:1 to 6:1 |
| Fashion & Apparel | 4:1 to 8:1 |
| Beauty & Cosmetics | 5:1 to 10:1 |
| Electronics | 3:1 to 5:1 |
| SaaS | 3:1 to 5:1 (often measured over longer periods) |
| Local Services | 3:1 to 6:1 |
| Luxury Goods | 2:1 to 4:1 (higher margin per sale offsets lower ratio) |
Good ROAS for E-commerce
Most e-commerce brands aim for somewhere between 4:1 and 6:1, though this shifts based on product margins. A brand selling $20 phone cases with tight margins needs a much higher ROAS than a brand selling $200 skincare sets with fat margins built in.
Good ROAS for Lead Generation
For lead gen, ROAS gets trickier since “revenue” isn’t immediate — it depends on your close rate and average deal size down the line. Businesses here often track a modified version, factoring in lead-to-customer conversion rates before calling a ROAS “good” or “bad.”
Good ROAS for SaaS Businesses
SaaS companies often need to look at ROAS over a longer window since customer lifetime value matters more than the first month’s revenue. A 3:1 ROAS in month one might actually be fantastic once you factor in twelve months of subscription revenue from that same customer.
Good ROAS for Local Businesses
Local businesses — think dentists, gyms, home service companies — often see solid results with a 3:1 to 6:1 range, but the real value often comes from repeat customers and referrals that don’t show up in the initial ROAS calculation at all.
Factors That Influence a Good ROAS
Margin, average order value, customer lifetime value, industry competition, and even how well your fulfillment and customer service operate all play into what “good” actually looks like for your specific business. There’s no universal number that works for everyone, no matter how many blog posts claim otherwise.
Factors That Affect ROAS
A lot of things quietly push your ROAS up or down, and most of them aren’t about the ad platform itself.
Audience Targeting
Poorly targeted ads waste spend on people who were never going to buy. Sharper targeting means your budget reaches people actually likely to convert, which directly lifts ROAS.
Ad Creative Quality
Generic, stale creative gets scrolled past. Creative that actually speaks to a real pain point or desire gets clicked, and clicks that convert are what drive ROAS upward.
Landing Page Experience
You can have a perfect ad and still tank your ROAS if the landing page is slow, confusing, or doesn’t match what the ad promised. People bounce, and that ad spend goes nowhere.
Product Pricing
Higher-priced products need fewer conversions to hit a strong ROAS, while low-ticket items need volume. Pricing strategy directly shapes what ROAS is even achievable.
Competition
More advertisers bidding on the same audience drives up costs, which can quietly erode your ROAS even if your own campaign hasn’t changed at all.
Seasonality
Q4 holiday shopping usually brings higher conversion rates but also higher competition and costs — sometimes it balances out, sometimes it doesn’t, depending on your specific market.
Customer Lifetime Value
A customer who buys once versus a customer who buys five times over a year completely changes what counts as an acceptable ROAS on that first purchase.
Conversion Rate
Even with great traffic, a low-converting site or offer will drag ROAS down no matter how cheap your clicks are.
Average Order Value
Bundle offers, upsells, and higher AOV strategies can lift ROAS without touching your targeting or creative at all — just by getting people to spend more per transaction.
ROAS vs ROI
People use these two interchangeably all the time, and honestly, it causes real confusion in budget meetings.
What Is ROI?
ROI, or Return on Investment, looks at overall profitability after all costs — not just ad spend, but product cost, overhead, salaries, shipping, everything. It’s a much broader financial metric than ROAS.
Key Differences Between ROAS and ROI
ROAS only considers ad spend against revenue generated. ROI considers total investment against total profit. So a campaign can show a fantastic 6:1 ROAS and still result in a negative ROI once you factor in the actual cost of goods sold and operational expenses.
Comparison Table
| Metric | Formula | What It Measures | Scope |
|---|---|---|---|
| ROAS | Revenue ÷ Ad Spend | Ad campaign efficiency | Narrow — ads only |
| ROI | (Profit − Investment) ÷ Investment | Overall business profitability | Broad — entire cost structure |
When to Use ROAS
Use ROAS when you’re specifically evaluating ad campaign performance — comparing platforms, testing creative, deciding where to shift ad budget. It’s the right tool for that narrow, tactical question.
When to Use ROI
Use ROI when you’re making bigger business decisions — should you expand the product line, is the whole marketing department actually generating profit, should the company increase overall spend across every channel, not just ads.
Can You Use Both Together?
Absolutely, and honestly, you should. ROAS tells you if the ad itself is efficient. ROI tells you if the business is actually making money after everything. Relying on just one gives you an incomplete picture, and plenty of businesses have gotten burned chasing a great ROAS while quietly losing money overall.
Limitations of ROAS
As useful as it is, ROAS isn’t the full story, and treating it like one leads to bad decisions.
Doesn’t Measure Overall Profitability
Again, ROAS only looks at revenue against ad spend. It says nothing about your actual profit margin after product costs, which is where a lot of businesses get tripped up celebrating a great-looking number.
Ignores Operating Expenses
Rent, salaries, software subscriptions, shipping costs, none of that factors into ROAS. A campaign can look amazing on paper while the business as a whole is still bleeding money elsewhere.
Doesn’t Include Customer Lifetime Value
ROAS typically looks at the first purchase only. It doesn’t account for repeat purchases, subscription renewals, or referral value a customer might bring over time, which can massively undersell a campaign’s true worth.
Doesn’t Reflect Brand Awareness
If your campaign’s goal was visibility and brand recall rather than immediate sales, ROAS will look weak even if the campaign did exactly what it was supposed to do.
Can Be Misleading Without Context
A 10:1 ROAS sounds incredible until you realize the campaign only spent $50 total and the sample size is basically meaningless. Context around spend volume and time period matters just as much as the ratio itself.
Should You Use ROAS or ROI?
Honestly, this isn’t really an either-or question once you understand what each one’s for.
Best Use Cases for ROAS
Day-to-day campaign optimization, comparing ad platforms, testing creative variations, and making quick calls on where to shift budget within your ad accounts.
Best Use Cases for ROI
Quarterly or annual business reviews, deciding whether to scale the whole marketing operation, evaluating whether a new product line is actually worth pursuing.
Using Both Metrics for Better Decision-Making
The smartest approach honestly just tracks both side by side. ROAS for the tactical, day-to-day ad decisions. ROI for the bigger strategic calls about where the business is actually headed financially.
How to Improve Your ROAS
Here’s what actually moves this number, not the generic “optimize your campaigns” advice you see everywhere.
Improve Audience Targeting
Narrowing in on lookalike audiences based on your best existing customers, rather than broad interest-based targeting, usually lifts ROAS by reaching people who are already primed to buy.
Optimize Ad Copy and Creatives
Testing different hooks, headlines, and visuals regularly keeps your ads from going stale, and fresh, relevant creative consistently outperforms recycled content.
Increase Landing Page Conversion Rate
Speeding up load times, simplifying checkout, and making sure the page actually matches what the ad promised can lift conversion rates significantly without spending an extra dollar on ads.
Reduce Customer Acquisition Costs
Tightening targeting, improving Quality Score, and refining bidding strategies all chip away at what you’re paying per customer, which directly boosts ROAS.
Improve Product Pages
Clear product photos, honest reviews, and straightforward pricing all reduce hesitation at the point of purchase, which means more of your ad clicks actually turn into sales.
Test Different Ad Formats
Video sometimes outperforms static images for certain products, and carousel ads sometimes beat both for others. Testing formats regularly uncovers what actually resonates with your specific audience.
Optimize Bidding Strategies
Switching between manual and automated bidding, or adjusting target ROAS bid strategies directly within platforms like Google Ads, can meaningfully shift how efficiently your budget gets spent.
Monitor Campaign Performance Regularly
Checking in weekly instead of monthly catches underperforming campaigns before they burn through significant budget, giving you room to adjust before real damage is done.
Free ROAS Calculator
How the Calculator Works
A ROAS calculator takes your ad spend and revenue figures and instantly returns your ratio, saving you from manually running the division every time you want to check a campaign’s performance.
Required Inputs
Just two numbers are needed — total ad spend and total revenue generated from that spend. Some calculators let you add multiple campaigns to compare side by side.
Benefits of Using a ROAS Calculator
It removes manual math errors, speeds up reporting when you’re managing multiple campaigns, and lets you quickly model different scenarios before committing more budget to a campaign.
Conclusion
So at the end of the day, ROAS is really just a gut check. Did the money you put into ads come back to you, and how much extra came with it? That’s it. No complicated theory behind it, just revenue divided by spend, giving you a fast read on whether a campaign is pulling its weight.
But here’s what trips people up, and honestly it’s the same mistake over and over. A great ROAS doesn’t automatically mean a healthy business. It means the ad worked in isolation. Once you factor in product costs, shipping, returns, and everything else running quietly in the background, that shiny 6:1 number can still leave you with barely any actual profit. That’s why pairing ROAS with ROI matters so much — one tells you if the ad campaign is efficient, the other tells you if the business as a whole is actually making money.
There’s no magic number that works for everyone either. A 3:1 might be a disaster for a business with thin margins and a 2:1 might be perfectly fine for a business selling high-ticket, high-margin products. Context always beats a universal benchmark, no matter how many charts claim otherwise.
Honestly, once you start tracking ROAS regularly, alongside conversion rate and customer lifetime value, it stops feeling like some intimidating agency metric and just becomes part of your normal routine. Check it, react to it, adjust your budget accordingly. Nothing fancy needed. It’s just the quickest, most honest way to know if your ad dollars are actually working for you, or quietly working against you.
Frequently Asked Questions
What Factors Affect ROAS?
Targeting precision, creative quality, landing page experience, pricing, competition, seasonality, customer lifetime value, conversion rate, and average order value all play a role, often together rather than in isolation.
What Are the Limitations of ROAS?
It ignores overall business costs, doesn’t reflect customer lifetime value, can be misleading with small sample sizes, and says nothing about brand awareness campaigns where sales weren’t the immediate goal.
Is ROAS the Same as ROI?
Nope, they’re related but different. ROAS only measures ad spend against ad-generated revenue, while ROI factors in the full cost structure of the business to measure overall profitability.
Should I Use ROAS or ROI?
Ideally both. ROAS for quick, tactical ad decisions. ROI for bigger strategic calls about the business as a whole.
What Is a Good ROAS?
It varies by industry and margin, but generally somewhere between 3:1 and 6:1 is considered solid for most e-commerce businesses, though luxury and high-margin products can do fine with a lower ratio.
Is a Higher ROAS Always Better?
Not necessarily. A high ROAS from a tiny, low-volume campaign doesn’t tell you much. Sustainable, consistent ROAS across meaningful spend levels matters more than one impressive-looking spike.
How Often Should You Measure ROAS?
Weekly at minimum for active campaigns, and daily during high-spend periods like product launches or holiday sales when things can shift quickly.
How Can You Increase ROAS?
Sharpen your audience targeting, refresh creative regularly, improve your landing pages, and keep testing different formats and bidding strategies rather than setting a campaign and forgetting about it.
Does ROAS Account for Refunds and Returns?
Not automatically in most platform dashboards. You often need to manually adjust your revenue figures to reflect actual net sales after returns for an accurate picture.
Can ROAS Be Negative?
Technically no, since it’s a ratio of revenue to spend and both are positive numbers. But a ROAS below 1 effectively means you lost money on that ad spend once you consider it generated less revenue than it cost.
Why Does My ROAS Look Different on Google Analytics Versus the Ad Platform Itself?
Attribution models differ between platforms. Meta might claim credit for a sale within a 7-day click window while Google Analytics uses a different attribution model entirely, leading to different numbers for the same sale.