

Most people find out their SEO isn’t working the hard way. They check Google Search Console, see their page sitting at position 3 for a keyword that gets 10,000 searches a month, and think they’ve won. Then they scroll down and see the clicks. 190. Maybe 220 on a good month. That’s a 2% click-through rate on a keyword that should be sending them 1,500 to 2,000 visits if the math worked out the way it should.
That gap, between where you rank and how many people actually click, is exactly what a CTR calculator exists to solve. It’s not a complicated tool. You put in your clicks, you put in your impressions, and it spits out a percentage. But the number it gives you tells you something no ranking report will: whether people actually want to visit your page after seeing it in search results. A page ranking at position 1 with a 2% CTR isn’t a success story, it’s a warning sign that something is broken in your title tag, your meta description, or your SERP appearance.
This post is going to break down exactly what a CTR calculator is, how the formula works, what good and bad CTR actually looks like across different channels and positions, and how to use the data to make real improvements. Not theoretical ones. The kind where you change a title tag on a Tuesday and see clicks go up by Friday. We’ll also get into why CTR matters for SEO beyond just traffic numbers, and how Google uses it as a signal whether they’ll admit it or not.
TL;DR
- CTR (click-through rate) is calculated by dividing clicks by impressions, then multiplying by 100 to get a percentage.
- A CTR calculator automates this math so you can quickly analyze performance across pages, keywords, or ad campaigns.
- Position 1 in Google averages around 27 to 28% CTR. Position 10 drops to roughly 2.5%.
- Low CTR on a high-ranking page usually means a weak title tag or meta description, not a ranking problem.
- Google Search Console gives you all the raw data you need to feed into a CTR calculator and find underperforming pages fast.
- Improving CTR on existing pages is often the fastest way to grow organic traffic without building new links or creating new content.
What a CTR Calculator Actually Does (and the Formula Behind It)
A CTR calculator is a tool, sometimes a standalone web app, sometimes built into a platform like Google Ads or Search Console, that takes two numbers and gives you a ratio. Those two numbers are clicks and impressions.
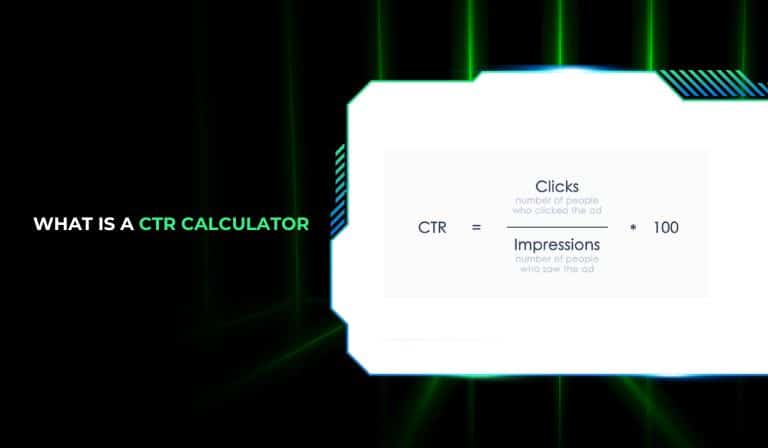
The formula is:
CTR = (Clicks / Impressions) x 100
So if your page appeared in search results 5,000 times last month and got 350 clicks, your CTR is (350 / 5,000) x 100, which equals 7%.
That’s it. The math is not the hard part. What’s hard is knowing what to do with the number once you have it, and understanding why the same CTR can be excellent in one context and terrible in another.
Why You Can’t Just Do This in Your Head
Look, the formula is simple enough that you can punch it into a calculator or a spreadsheet. But the reason dedicated CTR calculators exist, and the reason platforms like Google Search Console, Ahrefs, and SEMrush build them directly into their dashboards, is volume. If you’re managing a site with 300 pages and you want to see which ones are underperforming relative to their ranking position, you’re not doing 300 manual calculations. You want to filter, sort, and compare.
A CTR calculator in Search Console lets you see every page’s CTR alongside its average position. That combination is what makes it useful. A page at position 2 with a 4% CTR is a bigger problem than a page at position 8 with a 6% CTR. Without seeing both numbers together, you’d miss that completely.
Clicks vs. Impressions: What Actually Counts
One thing people get wrong early on: impressions don’t mean people saw your page in a focused, considered way. In Google Search Console, an impression is counted when your URL appears in a search result that the user could theoretically see. If your result is below the fold and the user didn’t scroll, it still counts as an impression in most reporting.
This matters because it means your CTR in Search Console might be slightly deflated compared to reality. Not drastically, but enough to know. When a CTR calculator shows you 1.8% for a page, that number includes impressions where the user never physically saw your result. Keep that in mind when you’re judging whether a number is actually bad or just looks bad.
How to Use a CTR Calculator Step by Step
Here’s the exact process.
Go to Google Search Console. Click on “Performance.” You’ll see total clicks, total impressions, average CTR, and average position at the top. Below that is a table of your top pages and queries.
Export that data to a spreadsheet. Google Sheets or Excel, doesn’t matter. Now you have clicks and impressions for every page and every keyword.
Add a column next to your data labeled “CTR Check.” Use the formula = (clicks/impressions)*100. This is your CTR calculator column. Now you can sort by CTR and immediately see which pages are underperforming relative to their position.
Cross-reference CTR against average position. Pages ranking 1 to 3 with CTR below 10% need attention fast. Pages ranking 4 to 10 with CTR below 3% are probably losing clicks to competitors with better title tags or rich results like featured snippets and star ratings.
That’s the workflow. No fancy tool required, just Search Console data and a spreadsheet column doing the CTR math.
CTR Benchmarks You Should Actually Know Before Using a CTR Calculator
Here’s where most guides either give you benchmarks without context or throw out a number like “5% is good” without explaining what good means for your specific situation. Both are useless.
CTR benchmarks depend on three things: the channel you’re measuring (organic search, paid ads, email), the ranking position (for organic), and the type of query (branded vs. non-branded, navigational vs. informational vs. transactional).
Organic Search CTR by Position
Based on data from studies run by Backlinko on over 4 million search results, and more recent analysis from Advanced Web Ranking, here’s roughly what organic CTR looks like by position:
Position 1: 27 to 28%
Position 2: 15 to 16%
Position 3: 11%
Position 4: 8%
Position 5: 7%
Position 6: 5%
Position 7: 4%
Position 8: 3.5%
Position 9: 3%
Position 10: 2.5%
Drop to page 2, and you’re looking at less than 1% average CTR across most positions. Position 11 averages around 1%. By position 20, it’s fractions of a percent.
Those numbers explain why getting from position 10 to position 1 can mean a 10x increase in traffic on the same keyword, even if your impressions stay roughly constant.
What “Good” CTR Looks Like for Paid Ads
For Google Ads, benchmarks shift a lot by industry. The overall average across all industries sits around 3.17% for search ads. But a locksmith emergency service might see 8 to 10% because the search intent is so immediate and the ad copy is highly specific. A B2B SaaS company might struggle to hit 2% because buyers are doing research, not clicking the first thing they see.
For display ads, which appear on websites in the Google Display Network rather than in search results, 0.1% is actually normal. If your display campaign is hitting 0.5%, you’re doing well. These numbers seem tiny because they are. Display ads interrupt people. Search ads answer people. That difference shows up in the data every single time.
Email CTR: The Most Misunderstood Number
Email marketers often confuse open rate with CTR. They’re not the same. CTR in email is the percentage of people who clicked a link inside the email. Open rate is just who opened it.
Average email CTR across industries is around 2.6% according to Mailchimp’s benchmarks. But again, that shifts wildly. A highly segmented re-engagement email to warm leads can hit 10% CTR. A cold outreach sequence might struggle to break 1%.
When you use a CTR calculator for email campaigns, you’re dividing total clicks by total delivered (not opens). Some tools calculate it as clicks divided by opens, which gives you a click-to-open rate (CTOR). Different metric, different number. Make sure you know which one your platform is reporting.
Branded vs. Non-Branded Queries
Here’s something worth knowing: branded queries, searches where someone types your brand name directly, will almost always show much higher CTR than non-branded queries. A person searching “Nike running shoes” and seeing Nike’s website at position 1 is going to click at a much higher rate than a person searching “best running shoes” and seeing Nike at position 1.
When you’re analyzing your CTR data in Search Console, filter branded queries out separately. If you lump them in with everything else, they inflate your average and hide how poorly your non-branded content might actually be performing.
How Google Uses CTR as a Ranking Signal (and Why This Matters for Your Strategy)
This one is a bit of a debate in the SEO industry and has been for years. Google officially says click-through rate is not a direct ranking factor. But there’s enough indirect evidence, and one major direct leak, to make a strong case that CTR behavior influences rankings in ways that matter.
The 2024 Google API Leak
In May 2024, a large cache of internal Google Search documentation was leaked and analyzed publicly by SEO researchers including Rand Fishkin and Mike King. One of the documents referenced something called “NavBoost,” an internal system Google uses that incorporates user interaction signals, including click data, into how pages are scored and ranked.
That’s not proof of CTR as a simple direct factor. It’s more nuanced than that. Google appears to look at click patterns relative to expectations. If a page at position 3 is getting far more clicks than the typical position 3 result, and users are spending time on that page rather than bouncing back to the search results, that’s a positive signal. If a page at position 1 has an unusually low CTR and high pogo-sticking (people clicking back to Google quickly), that’s a negative signal.
So when you use a CTR calculator and find a page with a 2% CTR at position 2, you’re not just seeing a traffic problem. You might be seeing an early warning that this page could slide in rankings if the pattern continues.
The Dwell Time Connection
CTR alone doesn’t capture the full picture of what Google cares about. What matters is the complete click pattern: who clicks, whether they stay, and whether they go back to the search results looking for something better. Google refers to this conceptually as “long clicks” vs. “short clicks.”
A long click means the user clicked your result, spent time on your page, found what they needed, and didn’t come back to search. That’s a strong positive signal. A short click means they bounced back within seconds. That’s a negative one.
Your CTR calculator tells you the first part of this story: did they click? Your analytics tells you the second part: did they stay? You need both numbers together to know whether your page is actually doing its job.
Practical Implication: CTR Optimization Before Link Building
Here’s an opinion worth taking seriously: if your page has a 2% CTR at position 4, building more links to that page is not the first thing to do. Get the CTR up first. A page at position 4 with an 8% CTR is earning twice the traffic of your current state, and potentially sending positive signals that could help it move to position 3 or 2 over time.
Fixing a title tag takes 10 minutes. Building links takes months. Do the math.
Using a CTR Calculator to Find and Fix Underperforming Pages
This is the practical section. All the theory above feeds into a real workflow you can run on your own site this week. No agency required.
Finding Pages That Need Help
Open Google Search Console. Go to Performance, then open the Pages tab. You’ll see clicks, impressions, CTR, and average position for each URL.
Sort by impressions, high to low. These are your most visible pages, the ones getting the most chances to earn a click. Now look at their CTR. Any page with over 1,000 impressions and under 5% CTR is a candidate for optimization.
Cross-reference with position. If that page is sitting at position 1 to 3 and still has a 3% CTR, something is seriously wrong with how it looks in the search results. Featured snippets eating clicks is one reason. A title tag that doesn’t match search intent is another. Competing results with star ratings or site links might be stealing attention from your result.
Diagnosing Why CTR Is Low
Run through this checklist for any underperforming page:
Does the title tag match the exact language people use when searching? “Best Practices for Email Marketing Automation” sounds professional. “Email Automation Tips That Actually Work” might get more clicks because it sounds more direct and less like a corporate whitepaper.
Is the meta description doing any work? A lot of sites still leave meta descriptions blank or write something generic like “Learn about our services.” Google sometimes auto-generates descriptions from page content, but those often miss the mark. Writing a specific, benefit-forward meta description with a call to action like “See the 7 most common mistakes” consistently lifts CTR.
Are competitors showing rich results that yours doesn’t have? If three out of five results above the fold have star ratings from review schema and yours doesn’t, you’re going to lose clicks even from position 2. Adding structured data (schema markup) for reviews, FAQs, or how-to content can add visual elements to your result that increase CTR without changing your ranking at all.
Is there a featured snippet taking your clicks? If your page ranks position 1 but there’s a featured snippet above it from another site, your CTR will be suppressed. In this case, the goal shifts: optimize your content to win the snippet itself. Format your content to directly answer the query in 40 to 60 words, and structure it clearly below an H2 that matches the question. Winning the featured snippet at position 4 can outperform having position 1 without it.
Running A/B Tests on Title Tags
Google Search Console doesn’t have a built-in A/B testing feature for titles, but you can run a manual test. Change the title tag on a low-CTR page. Record the date. Give it 3 to 4 weeks. Export the CTR data for that page for the same number of weeks before and after. Compare.
This isn’t a perfect controlled experiment because search impressions fluctuate for other reasons. But if your CTR goes from 2.1% to 5.8% after a title change, and your impressions stayed roughly the same, that’s a real signal. Scale it. Go find the next 10 underperforming pages and do the same thing.
How Many Pages Should You Optimize at Once?
Honestly, start with 5 to 10. Pick the pages that have the highest impressions but lowest CTR. Those have the most traffic sitting on the table. After you change the title tags and meta descriptions, let them run for a month before judging. Some will move fast. Others won’t. But even if you improve average CTR from 3% to 5% on your top 10 pages, on a site with 50,000 monthly impressions across those pages, you’ve just added roughly 1,000 clicks a month for free.
CTR Calculator for Google Ads: Where It Gets More Expensive
Everything said about organic CTR applies to paid search too, but the stakes are different. In paid ads, a low CTR doesn’t just mean less traffic. It means a lower Quality Score in Google Ads, and a lower Quality Score means paying more per click. Sometimes a lot more.
Quality Score and the CTR Link
Google Ads uses Quality Score (a scale of 1 to 10) to determine how much you pay per click and where your ad shows up in the auction. CTR is one of the three main components of Quality Score, alongside expected CTR based on historical performance and landing page experience.
If your expected CTR is below average for your keyword and ad position, your Quality Score drops. And for every point your Quality Score drops below 6, you might be paying 16 to 30% more per click than a competitor with a higher score. Run that through your own CTR calculator logic and it gets ugly fast. A 10% CTR difference in ad copy can mean a 25% cost difference on the same keyword.
What Good Ad CTR Looks Like
For Google Search Ads, the Google benchmark across all industries is around 3.17% CTR. Anything above 5% for non-branded keywords is solid. Above 8% is excellent and usually means very tight ad group structure (single keyword ad groups or SKAGs) combined with ad copy that directly mirrors the search term.
For Shopping ads, which are those product image ads at the top of Google, average CTR is lower, around 0.86%. For display ads, as mentioned earlier, 0.1% is the baseline. These numbers are very different from search CTR and should be tracked separately.
If you’re using a CTR calculator to evaluate your ad account, don’t blend search, shopping, and display CTR into a single number. They’re measuring completely different behaviors and comparing them is meaningless.
Ad Copy Changes That Actually Move CTR
Numbers in headlines increase ad CTR. “Save 35% on Annual Plans” outperforms “Save on Annual Plans” almost every time in tests. Specific numbers create specificity, and specificity creates trust in an ad.
Questions in headlines work for informational intent. “Looking for the Best CRM Software?” converts better for research-phase searches than a direct offer headline.
Countdown timers in ads, using Google’s built-in countdown customizer, create urgency that lifts CTR for limited-time offers. A client running a flash sale saw their ad CTR jump from 3.8% to 7.1% just by adding a 48-hour countdown to the ad copy.
Conclusion
The CTR calculator is one of those tools that looks basic until you actually use it on your own data. Then you realize how many ranking positions you’re wasting because the page doesn’t look compelling enough in search results to earn the click. Position doesn’t equal traffic. CTR is the bridge between the two.
Start with Search Console today. Pull your top 20 pages by impressions. Run the CTR formula. Find the ones with high visibility and low click rates. Those are your fastest wins, faster than a new backlink campaign, faster than a site redesign. Rewrite three title tags this week and watch what happens over the next month. That’s where this starts.
Frequently Asked Questions
What is a CTR calculator used for?
A CTR calculator is used to measure click-through rate, which is the percentage of people who click on a link after seeing it. You input the number of clicks and the number of impressions (how many times the link was shown), and the calculator gives you a percentage. It’s used in SEO to measure organic search performance, in Google Ads to measure ad effectiveness, and in email marketing to measure how many recipients clicked a link inside an email.
What is the formula for CTR?
The CTR formula is: CTR = (Clicks / Impressions) x 100. For example, if a page got 400 clicks and 8,000 impressions, the CTR is (400 / 8,000) x 100, which equals 5%. This formula works for any channel, whether you’re calculating organic search CTR, paid ad CTR, or email CTR.
What is a good CTR for SEO?
It depends on ranking position. At position 1 in Google organic search, a CTR of 25 to 30% is typical. At position 3, you’re looking at around 10 to 11%. At position 5, expect around 6 to 7%. Any organic result ranking in positions 1 to 3 with a CTR below 10% is underperforming and worth investigating. For positions 4 to 10, below 3% CTR usually signals a weak title tag or a competitor with richer SERP features.
How does CTR affect SEO rankings?
Google hasn’t confirmed CTR as a direct ranking factor, but the 2024 Google API leak revealed an internal system called NavBoost that incorporates user interaction data including clicks. The practical effect is that pages with unusually high CTR relative to their ranking position tend to hold or improve their rankings, while pages with very low CTR sometimes slide down. It’s not a simple cause-and-effect, but CTR behavior feeds into broader user satisfaction signals that Google does measure.
What is the difference between CTR and conversion rate?
CTR measures how many people clicked on a link. Conversion rate measures how many people took a desired action after arriving on the page, like buying a product, signing up for a newsletter, or filling out a form. A page can have a high CTR (lots of people clicking) with a low conversion rate (few people completing the goal), which usually means the page attracts the wrong audience or fails to deliver on what the title tag promised.
Can I improve CTR without changing my ranking position?
Yes. You can improve CTR by rewriting title tags and meta descriptions to be more specific, benefit-driven, and aligned with search intent. You can add structured data markup to get rich results like star ratings or FAQ dropdowns in your SERP listing. You can use numbers and strong action words in your titles. All of these changes affect how your result looks without touching your actual ranking position, and the click-through rate improvements can be significant, sometimes 2 to 3 times the original CTR.
What CTR is considered low for Google Ads?
For Google Search Ads, a CTR below 1% is generally considered low and suggests the ad copy doesn’t match what the searcher is looking for, or the keyword targeting is too broad. A CTR between 1% and 3% is average. Above 5% is strong for most industries. However, benchmarks vary by industry. For competitive niches like legal or finance, even 2 to 3% can be acceptable because those keywords are expensive and highly competitive.
How do I find my page’s CTR in Google Search Console?
Go to Google Search Console, click on “Performance” in the left sidebar, then click on the “Pages” tab in the report below the chart. This shows you the average CTR for each URL on your site alongside total clicks, impressions, and average position. You can also click on any individual page to see CTR broken down by the specific queries that triggered impressions for that URL.
Why is my CTR dropping even though my ranking hasn’t changed?
A few common reasons: a competitor who wasn’t ranking for your keyword now shows up and has better title tags or rich results. Google added a featured snippet above your result that answers the query without requiring a click. Your title tag has become less relevant to how searchers are phrasing their queries over time. Seasonal intent shifts can also change how many people are searching and clicking. Use Search Console to look at CTR trends alongside impression trends. If impressions stayed the same but CTR dropped, the problem is usually SERP competition or your appearance in the results.
Is CTR the same in organic search and paid ads?
No. Organic CTR and paid ad CTR measure the same basic thing (clicks divided by impressions) but operate in completely different contexts and with different average benchmarks. Organic position 1 averages 27 to 28% CTR. Paid search ads average around 3% industry-wide, though the top ad position on a high-intent keyword can hit 10 to 15%. They should always be tracked separately. Blending them gives you a number that doesn’t represent either channel accurately.
Does a higher CTR always mean better performance?
Not always. A very high CTR with low dwell time and high bounce rate can actually be a negative signal. If your title tag overpromises and the page underdelivers, people click and leave fast. Google can interpret this pattern as a sign that your page doesn’t actually satisfy the query. The goal is high CTR combined with good on-page engagement: time on page, low bounce rate, and ideally some scroll depth or conversion action. CTR gets people to the door. The page itself has to do the rest.