


Tracking marketing performance across multiple channels is harder than ever, with data scattered across ad platforms, analytics suites, CRMs, and social tools. Manual reporting often eats hours every week, increases the risk of errors, and delays decisions that should be data-driven and timely. Marketing reporting tools solve this by centralizing data, automating reports, and turning raw numbers into dashboards stakeholders can understand at a glance.
This blog walks through what marketing reporting tools are, why they matter, and how to choose the right one, then deep-dives into 10 popular tools used by marketers, agencies, and enterprises in 2026. The goal is to help you match your use case, budget, and tech stack with the right platform so you can boost analytics without adding reporting chaos.
What Are Marketing Reporting Tools?
Marketing reporting tools are software platforms that collect, aggregate, and visualize performance data from multiple marketing channels in one place. They typically connect to sources like Google Analytics, ad networks, email platforms, social media, and CRMs to build unified dashboards and reports.
Instead of downloading CSVs from every platform, these tools pull data automatically on a schedule or in real time, then display KPIs in charts, tables, and scorecards. Many tools also support role-based access and sharing, so different stakeholders see the metrics most relevant to them.
Key Benefits
Marketing reporting tools can save several hours per week by automating data collection and report creation that would otherwise be done manually in spreadsheets. They also reduce data-entry errors, standardize calculations, and make it easier to maintain consistent KPIs across campaigns and clients.
Because data is consolidated, teams can spot trends, channel performance shifts, and anomalies faster, supporting more agile optimization. Visual dashboards and scheduled reports also make it easier to communicate impact to leadership and clients without reinventing the wheel every reporting cycle.
Essential Features to Look For
When evaluating marketing reporting tools, focus on features that directly support your workflows and data needs. At a minimum, most teams look for:
- Multi-channel integrations with key platforms (e.g., Google Analytics, Meta Ads, LinkedIn Ads, HubSpot, Salesforce).
- Customizable dashboards and report templates to reflect your KPIs and branding.
- Automation for data refresh and scheduled report delivery via email or links.
- Export capabilities (PDF, CSV, slides) for stakeholders who prefer offline reports.
- Role-based access or client portals where applicable.
- Scalability in terms of data volume, users, and number of connected accounts.
More advanced teams may also prioritize AI-assisted insights, anomaly detection, and predictive analytics as these capabilities mature in 2026.
Top 10 Marketing Reporting Tools (2026)
1. Google Data Studio / Looker Studio
Google rebranded Data Studio as Looker Studio and continues to position it as a free, cloud-based data visualization and reporting product tightly integrated with the Google ecosystem. It is widely used by marketers for building dashboards on top of Google Analytics, Google Ads, YouTube, and Google Sheets data.
Best For
Looker Studio is particularly suitable for small to mid-size teams, agencies starting with dashboarding, and organizations heavily invested in Google Marketing Platform and Google Workspace.
Key Features
- Native connectors to Google Analytics, Google Ads, Search Console, YouTube, and BigQuery.
- Community and partner connectors for many non-Google platforms via third parties like Supermetrics.
- Customizable, interactive dashboards with filters, date range controls, and drill-down capabilities.
- Sharing and collaboration features similar to other Google Workspace tools, including viewer/editor roles and link sharing.
Pricing
Looker Studio itself is free to use, though some partner connectors that feed data into it require separate paid subscriptions.
Pros
Looker Studio’s biggest advantages are zero license cost, ease of sharing, and tight integration with popular Google products many marketers already use daily. The platform supports a wide variety of visualization components that can cover most standard marketing reporting needs.
Cons
For very large datasets or complex enterprise data models, performance and governance can be limiting compared with full-scale BI platforms. Marketers often rely on third-party connectors for many non-Google data sources, which adds cost and configuration steps.
Ideal Users
In-house teams or agencies running primarily on Google Analytics, Google Ads, and YouTube—especially those needing free or low-cost dashboarding—tend to get strong value from Looker Studio.
2. Tableau
Tableau is an enterprise-grade business intelligence and data visualization platform used across industries for advanced analytics and interactive dashboards. Marketing teams use it when they need to blend web analytics, offline data, and business metrics into a single analytical environment.
Best For
Tableau is best suited for medium to large organizations with complex reporting needs, dedicated analysts, and a requirement to integrate marketing data with broader business data such as revenue and operations.
Key Features
- Rich library of interactive visualizations including maps, advanced charts, and custom dashboards.
- Live and extract-based data connections to databases, cloud warehouses, spreadsheets, and marketing data sources via connectors or ETL tools.
- Support for advanced calculations, custom metrics, and statistical modeling within dashboards.
- Collaboration capabilities through Tableau Server or Tableau Cloud for shared dashboards and governed access.
Pricing
Publicly listed pricing for Tableau often starts around a per-user monthly fee for Creator or Explorer licenses, with exact costs varying by deployment model and region.
Pros
Tableau excels at handling large and complex datasets, offers high flexibility for custom analysis, and can serve cross-functional teams beyond marketing. Its visual capabilities make it well-suited for executive dashboards and data exploration.
Cons
Compared to lighter tools, Tableau requires more technical skill to set up and maintain, and total cost of ownership is higher when factoring in licenses and infrastructure. It may be more than small teams need for straightforward channel reporting.
Ideal Users
Enterprises and data-driven organizations that see marketing as part of a broader analytics landscape and have analysts or data engineers on staff benefit most from Tableau.
3. Klipfolio
Klipfolio is a cloud-based dashboard and reporting platform designed to help businesses create custom KPI dashboards by connecting multiple data sources. Marketers and agencies use it to build always-on views of campaign performance across digital channels.
Best For
Klipfolio is well-suited for agencies and in-house teams needing flexible dashboards with a moderate learning curve and strong support for marketing integrations.
Key Features
- Integrations with a wide range of sources, including marketing platforms, spreadsheets, and databases.
- Customizable dashboards for KPIs, including formulas and calculated metrics.
- Options for scheduled reporting and client-friendly views.
Pricing
Klipfolio offers tiered subscription plans, with pricing varying based on features, user counts, and the number of dashboards; details are typically published on its pricing page.
Pros
Users appreciate Klipfolio’s balance of flexibility and marketing focus, along with its ability to centralize KPIs for quick performance monitoring. It can be a cost-effective alternative to heavier BI tools for marketing-centric use cases.
Cons
For very large-scale data or highly complex transformations, Klipfolio may require additional tooling, and some users report a learning curve when designing advanced formulas. Its community and ecosystem are smaller than those of the largest BI platforms.
Ideal Users
Agencies and marketing teams managing multi-channel campaigns who need dashboards rather than full-blown enterprise BI typically find Klipfolio a practical fit.
4. HubSpot Reporting Dashboard
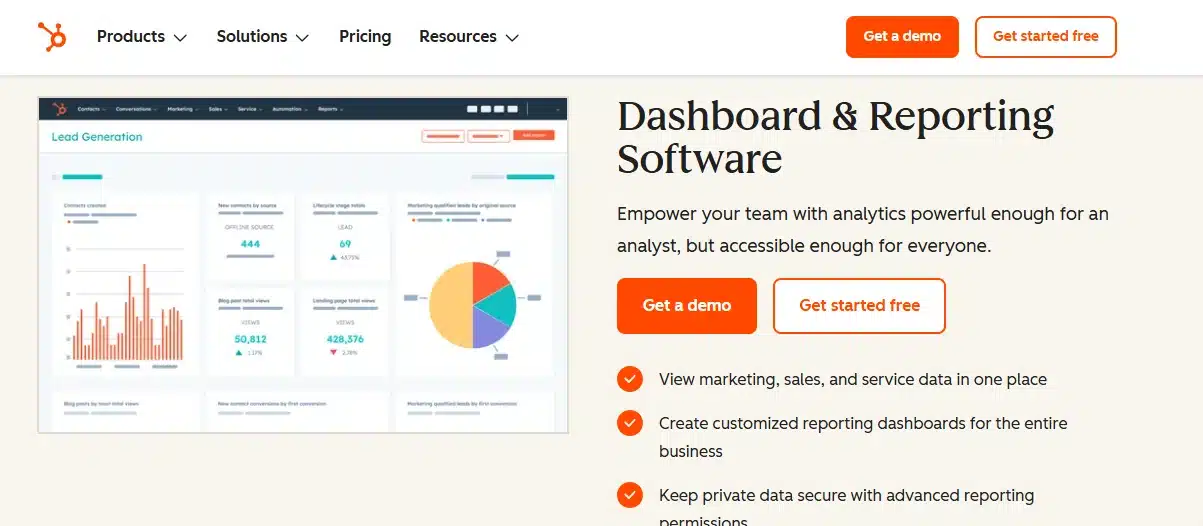
HubSpot includes built-in reporting and dashboards across its CRM, marketing, sales, and service hubs, giving users a native view of the funnel. For teams already using HubSpot for email, automation, and CRM, the reporting suite centralizes performance metrics without extra tools.
Best For
HubSpot’s reporting is best for organizations that run a significant portion of their marketing and sales activity within the HubSpot ecosystem.
Key Features
- Pre-built dashboards for email performance, website analytics, deals, pipeline, and customer interactions.
- Custom report builders combining objects like contacts, companies, deals, and marketing activities.
- Attribution reporting to show how marketing touchpoints contribute to revenue, depending on plan level.
Pricing
Reporting capabilities are included with HubSpot’s various hubs and tiers; more advanced reporting features and attribution are available on higher-tier plans with higher monthly subscription costs.
Pros
Because data lives in one system, HubSpot can show the full customer journey from first touch through closed deal without complex integrations. The interface is generally accessible to non-technical marketers.
Cons
Reporting is strongest for data that already resides in HubSpot, and using it as a central reporting tool for many external ad or analytics platforms may require extra connectors or manual steps. Flexibility for highly custom dashboards is more limited than in dedicated BI tools.
Ideal Users
Growing B2B teams and inbound-focused organizations that already rely on HubSpot and want unified marketing-and-sales reporting within the same platform see strong benefits.
5. Supermetrics

Supermetrics is a marketing data pipeline and connector platform that moves data from ad, analytics, and other marketing tools into destinations like spreadsheets, data warehouses, and BI tools. Rather than being a dashboarding tool itself, it underpins reporting by centralizing and structuring data.
Best For
Supermetrics is ideal for teams with multiple marketing platforms that want to build their own dashboards in tools like Looker Studio, Excel, Google Sheets, Power BI, or data warehouses.
Key Features
- Connectors for a broad range of marketing sources, including major ad networks, web analytics, and social platforms.
- Scheduled data pulls into destinations like Google Sheets, BigQuery, Snowflake, and Looker Studio.
- Templates and prebuilt reports for common marketing use cases.
Pricing
Supermetrics offers tiered plans with pricing varying by destination, number of data sources, and refresh frequency; entry-level packages for individuals and small teams start in a lower monthly price range and scale up for larger deployments.
Pros
By separating data movement from visualization, Supermetrics lets teams choose their preferred reporting front-end while automating complex data collection. It is especially helpful for consolidating paid media data across many channels.
Cons
Because it is not a standalone dashboard product, users must combine Supermetrics with other tools to build visual reports. Pricing can increase as more data sources and destinations are added.
Ideal Users
Agencies, performance marketing teams, and analytics-focused organizations that want flexible, warehouse-centric or spreadsheet-centric reporting setups benefit most from Supermetrics.
6. Domo
Domo is a cloud-based business intelligence and analytics platform that emphasizes real-time dashboards, extensive data connectors, and collaboration features. Marketing teams use Domo to combine channel metrics with sales, finance, and operational data for executive-level views.
Best For
Domo tends to fit mid-sized to large organizations that need a scalable analytics platform for many users and data sources, including marketing.
Key Features
- Large catalog of native connectors to cloud apps, databases, and marketing platforms.
- Real-time and scheduled data refresh, with options for alerts.
- Collaborative features like shared cards, comments, and data governance controls.
Pricing
Public sources indicate that Domo does not list detailed pricing on its website and typically offers custom quotes; it is generally perceived as a premium-priced solution relative to lighter tools.
Pros
Domo’s breadth of connectors and focus on real-time dashboards make it appealing for executives who want up-to-date views of key marketing and business metrics. It can centralize reporting across departments in a single platform.
Cons
The combination of custom pricing, implementation requirements, and advanced capabilities means Domo can be cost-prohibitive for smaller teams. It also requires dedicated ownership to maintain data models and governance.
Ideal Users
Larger organizations with cross-functional analytics needs, budgets for enterprise BI, and a desire for unified dashboards across marketing and non-marketing data sets gain the most from Domo.
7. Metabase
Metabase is an open-source business intelligence and analytics tool that lets users ask questions of their data using a graphical interface or SQL. While not marketing-specific, it is often adopted by teams that want a self-hosted or cloud BI solution with strong control over data.
Best For
Metabase is particularly attractive to technical teams, startups, and organizations that already maintain databases or warehouses and prefer open-source or self-managed analytics.
Key Features
- Ability to connect to many relational databases and warehouses used in analytics stacks.
- Dashboards and question-based exploration that allow non-technical users to interact with prepared queries.
- Options for self-hosted deployment or managed cloud services with additional features.
Pricing
Metabase offers a free open-source edition for self-hosting and paid cloud or enterprise tiers with pricing based on features and user counts.
Pros
The open-source option can reduce license costs and provide flexibility for teams with engineering support. Metabase can serve as a central BI layer for all company data, including marketing.
Cons
Marketing teams without technical resources may find setup and data modeling challenging, since it relies on well-structured databases rather than plug-and-play marketing connectors. It also lacks some marketing-focused templates present in specialized tools.
Ideal Users
Data-savvy teams with engineers or analysts who can manage databases and want a customizable BI environment with control over infrastructure are the best fit for Metabase.
8. Microsoft Power BI
Power BI is Microsoft’s business analytics service that integrates closely with tools like Excel, Azure, and SQL Server. Marketing teams adopt it to connect advertising, web, and CRM data into dashboards that align with broader business reporting.
Best For
Power BI is well-suited for organizations already invested in Microsoft technologies, including Office 365 and Azure, and that want BI capabilities without adopting a separate vendor ecosystem.
Key Features
- Native connectors to many Microsoft and non-Microsoft data sources.
- Desktop and cloud components for building, publishing, and sharing reports.
- Support for DAX formulas and robust data modeling for advanced metrics.
Pricing
Power BI typically offers entry-level per-user pricing for Pro licenses, with higher tiers like Premium providing dedicated capacity and additional features.
Pros
The pricing model is generally competitive relative to other enterprise BI tools, and integration with Excel and other Microsoft products simplifies adoption for existing users. It is capable of handling sophisticated data models and large-scale deployments.
Cons
Non-technical marketers may require training to take full advantage of its modeling and formula capabilities. As a general BI platform, it may require extra configuration to become a tailored marketing reporting environment.
Ideal Users
Companies standardizing on Microsoft stacks and willing to invest in BI skills gain strong value from Power BI as their central analytics layer, including marketing dashboards.
9. Whatagraph

Whatagraph is a marketing reporting and dashboard platform designed with agencies and in-house marketing teams in mind, focusing on automated, visual client-ready reports. It emphasizes ease of use and white-labeling for agencies managing multiple accounts.
Best For
Whatagraph is particularly suited for marketing agencies and teams that need recurring, visually polished reports across many channels and clients.
Key Features
- Integrations with a broad range of marketing channels, including ads, analytics, and social platforms.
- Automated, scheduled reports that can be branded and sent to clients.
- Pre-built templates for common reporting scenarios like PPC, SEO, and social media.
Pricing
Whatagraph offers subscription plans with pricing determined by the number of users, data sources, and client workspaces; details are typically available on its pricing page and are positioned for agency budgets.
Pros
Agencies value Whatagraph for its ability to reduce manual report-building time and produce consistent, client-friendly formats. White-labeling and templates simplify onboarding new clients.
Cons
Compared with general-purpose BI platforms, customization depth and advanced analytical capabilities may be more limited. Costs can rise as the number of clients and connections increases.
Ideal Users
Digital marketing agencies and in-house teams managing many stakeholders who care most about clear, automated performance summaries are strong candidates for Whatagraph.
10. Powering Your Stack with Combinations
In practice, many organizations combine tools rather than relying on a single platform for all marketing reporting tasks. For example, some teams use Supermetrics to pipe data into a warehouse, then visualize it in Looker Studio, Tableau, or Power BI, while agencies may complement Whatagraph with spreadsheets for ad-hoc analysis.
This combinational approach allows teams to pair specialized marketing reporting tools with broader BI platforms to cover both campaign-level dashboards and executive-level analytics. The right pairing depends on how centralized your data is, the skills of your team, and whether you prioritize speed of setup or analytical depth.
Comparison Table: Quick Reference
Below is a high-level reference summarizing core positioning of the tools discussed.
| Tool | Best For | Typical Pricing Position* | Primary Strengths |
| Looker Studio | Google-centric, budget-conscious teams | Free platform; paid connectors | Low cost, Google integrations, shareability |
| Tableau | Data-heavy, enterprise analytics | Mid–high per-user licensing | Advanced visuals, complex data handling |
| Klipfolio | Marketing teams and agencies | Tiered SaaS pricing | Flexible dashboards, marketing focus |
| HubSpot Reporting | HubSpot CRM-centric organizations | Included in HubSpot tiers | Native funnel view, ease for HubSpot users |
| Supermetrics | Multi-channel data consolidation | Tiered by sources/destinations | Connectors, automation into chosen BI tools |
| Domo | Cross-department enterprise BI | Custom / premium | Real-time, many connectors, collaboration |
| Metabase | Technical, open-source-oriented teams | Free OSS + paid cloud tiers | Self-hosting, SQL + GUI exploration |
| Power BI | Microsoft-centric organizations | Competitive per-user tiers | MS integration, strong modeling |
| Whatagraph | Agencies and client reporting | Agency-focused SaaS tiers | Templates, automation, white-labeling |
*Pricing descriptions are directional; exact figures depend on current vendor plans and contracts.
How to Choose the Right Tool for Your Business
1. Assess Your Needs
Choosing a marketing reporting tool starts with clarifying what problems you need to solve. Some teams mainly want to stop copying data into spreadsheets, while others need to unify dozens of channels and tie them to revenue.
Key considerations include team size and technical skill, number of platforms you use, expected growth in data volume, and whether you need client-facing or internal-only reports. Understanding these factors upfront helps narrow the field quickly.
2. Evaluation Criteria
Once needs are clear, evaluate tools against criteria linked to outcomes rather than just feature checklists. Common evaluation angles include:
- Ease of onboarding for your current team.
- Availability of native integrations for your top platforms.
- Flexibility to build the KPIs and dimensions you rely on.
- Ability to automate routine reporting without manual intervention.
- Governance, security, and permissions suitable for your organization size.
Pilots or trials with real data can reveal differences in usability that are hard to see on paper.
3. Implementation Tips
A thoughtful implementation can significantly increase adoption and ROI. Many teams benefit from starting with a small set of core dashboards—such as channel performance, funnel conversion, and revenue by source—before expanding.
It is helpful to document metric definitions, invest in basic training, and schedule periodic reviews to retire unused reports and refine dashboards. Where possible, automate both data refresh and report delivery to maintain consistency over time.
Conclusion
Marketing reporting tools are now a foundational layer for data-driven teams, turning raw channel data into accessible insights and freeing time for strategy and optimization. The right choice depends on where your data lives, how sophisticated your analysis must be, and whether you prioritize cost, speed of setup, or enterprise-grade capabilities.
Starting with a clear understanding of your requirements, testing a short list of platforms with real campaigns, and planning a phased rollout can help ensure that whichever tools you pick truly boost your analytics rather than adding another dashboard to maintain.

Passionate about blogging and focused on elevating brand visibility through strategic SEO and digital marketing. Always tuned in to the latest trends, I’m dedicated to maximizing engagement and delivering measurable ROI in the dynamic world of digital marketing. Let’s connect and unlock new opportunities together!