


Sales forecasting is the structured process of estimating future sales over a defined period using historical data, current pipeline information, and market conditions. Instead of relying on intuition, businesses use patterns in past performance and present opportunities to predict how many deals will close and how much revenue they are likely to generate.
This practice is critical because virtually every major business decision—how much to spend on marketing, how much inventory to order, or whether to hire more sales reps—depends on expectations of future revenue. A well-built forecast gives leaders a realistic picture of what is likely to happen so they can plan proactively rather than reactively.
In this blog, the focus is on what sales forecasting is, why it matters, the main types and methods, a step-by-step process to build forecasts, tools you can use, common mistakes, best practices, and how forecasting looks in different business models. The goal is to give a comprehensive, practical guide that can be applied in real organizations of different sizes and industries.
Key points:
- Sales forecasting is about predicting future sales using data, not guesswork.
- It underpins budgeting, hiring, marketing, and inventory decisions.
- This guide walks through definitions, methods, steps, tools, and real-world use cases.
What Is Sales Forecasting?
Sales forecasting is the process of predicting future sales for a company over a specific time frame, such as a month, quarter, or year. In practice, this means estimating how many deals will close and how much revenue those deals will generate, based on current and historical data.
At its core, a forecast is a structured estimate built from measurable factors like historical revenue, pipeline stages, conversion rates, and pricing, rather than a gut feeling from leadership. Because of that, forecasts can be tracked, tested, and improved over time as more data becomes available.
There is a close relationship between sales forecasting and revenue forecasting: sales forecasting focuses on the expected volume or value of sales, while revenue forecasting may incorporate additional financial factors like discounts, churn, or recurring revenue cycles. In many commercial contexts, the terms are used interchangeably because both refer to a forward-looking estimate of the company’s top-line performance.
A simple real-world example is a retail company looking at last year’s holiday season sales, adjusting for this year’s marketing campaigns and economic climate, and then estimating how much it will sell this coming holiday period. That estimate becomes the baseline for ordering inventory, staffing stores, and planning promotional offers.
Key points:
- Predicts future sales over defined time periods.
- Uses structured data (historical performance, pipeline, prices) instead of intuition.
- Closely related to revenue forecasting but focuses on sales volume/value.
Why Sales Forecasting Matters: Key Benefits
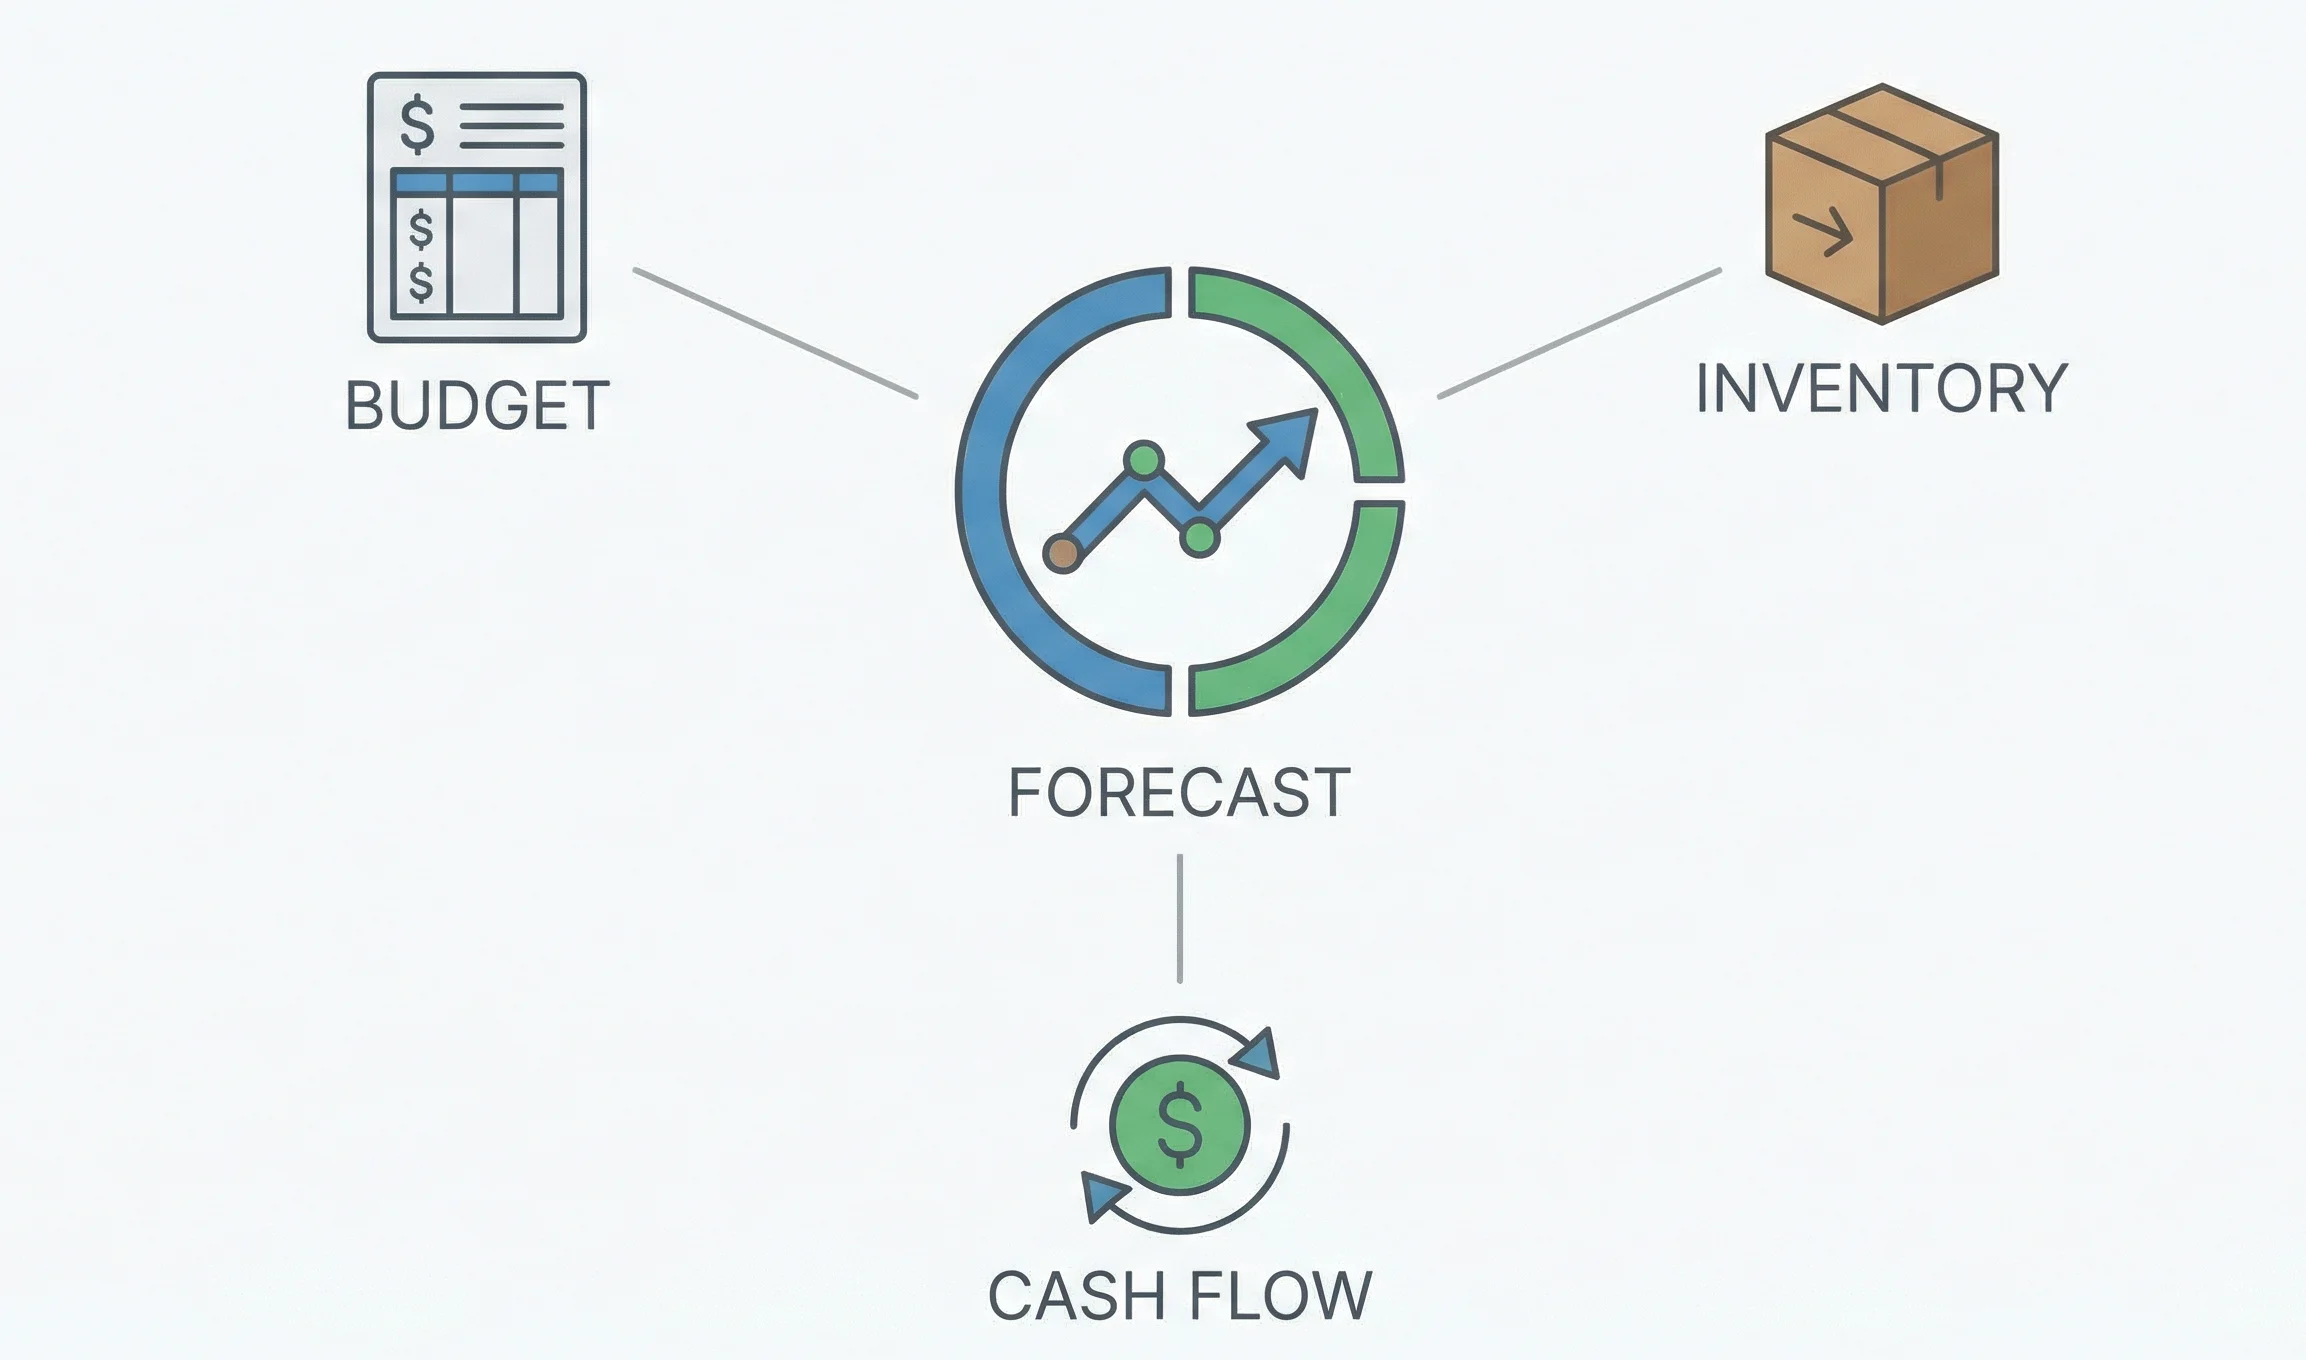
Sales forecasting matters because almost every major operational, financial, and strategic decision depends on an understanding of future revenue. Without a realistic forecast, organizations risk underinvesting and missing growth opportunities or overcommitting and running into cash or inventory problems.
Forecasts are particularly important for budgeting, because finance teams need a revenue baseline before they can decide what to spend on salaries, marketing, technology, and other expenses. They are also crucial for planning inventory in product-based businesses, where both stockouts and overstocking can be costly.
Accurate forecasting can improve cash flow management by identifying when revenue is likely to be strong or weak, enabling companies to time borrowing, investments, or cost controls more effectively. It also supports risk mitigation, because it highlights potential shortfalls far enough in advance that management can take corrective action through campaigns, pricing adjustments, or cost changes.
Finally, credible forecasts increase stakeholder confidence, because investors, lenders, and executives expect structured projections rather than vague expectations. In many organizations, a reliable forecasting process is seen as a mark of operational maturity and strategic discipline.
Key benefits:
- Better budgeting and financial planning.
- Smarter inventory and capacity planning.
- Improved cash flow visibility and risk management.
- Higher confidence from investors, lenders, and internal stakeholders.
Types of Sales Forecasts
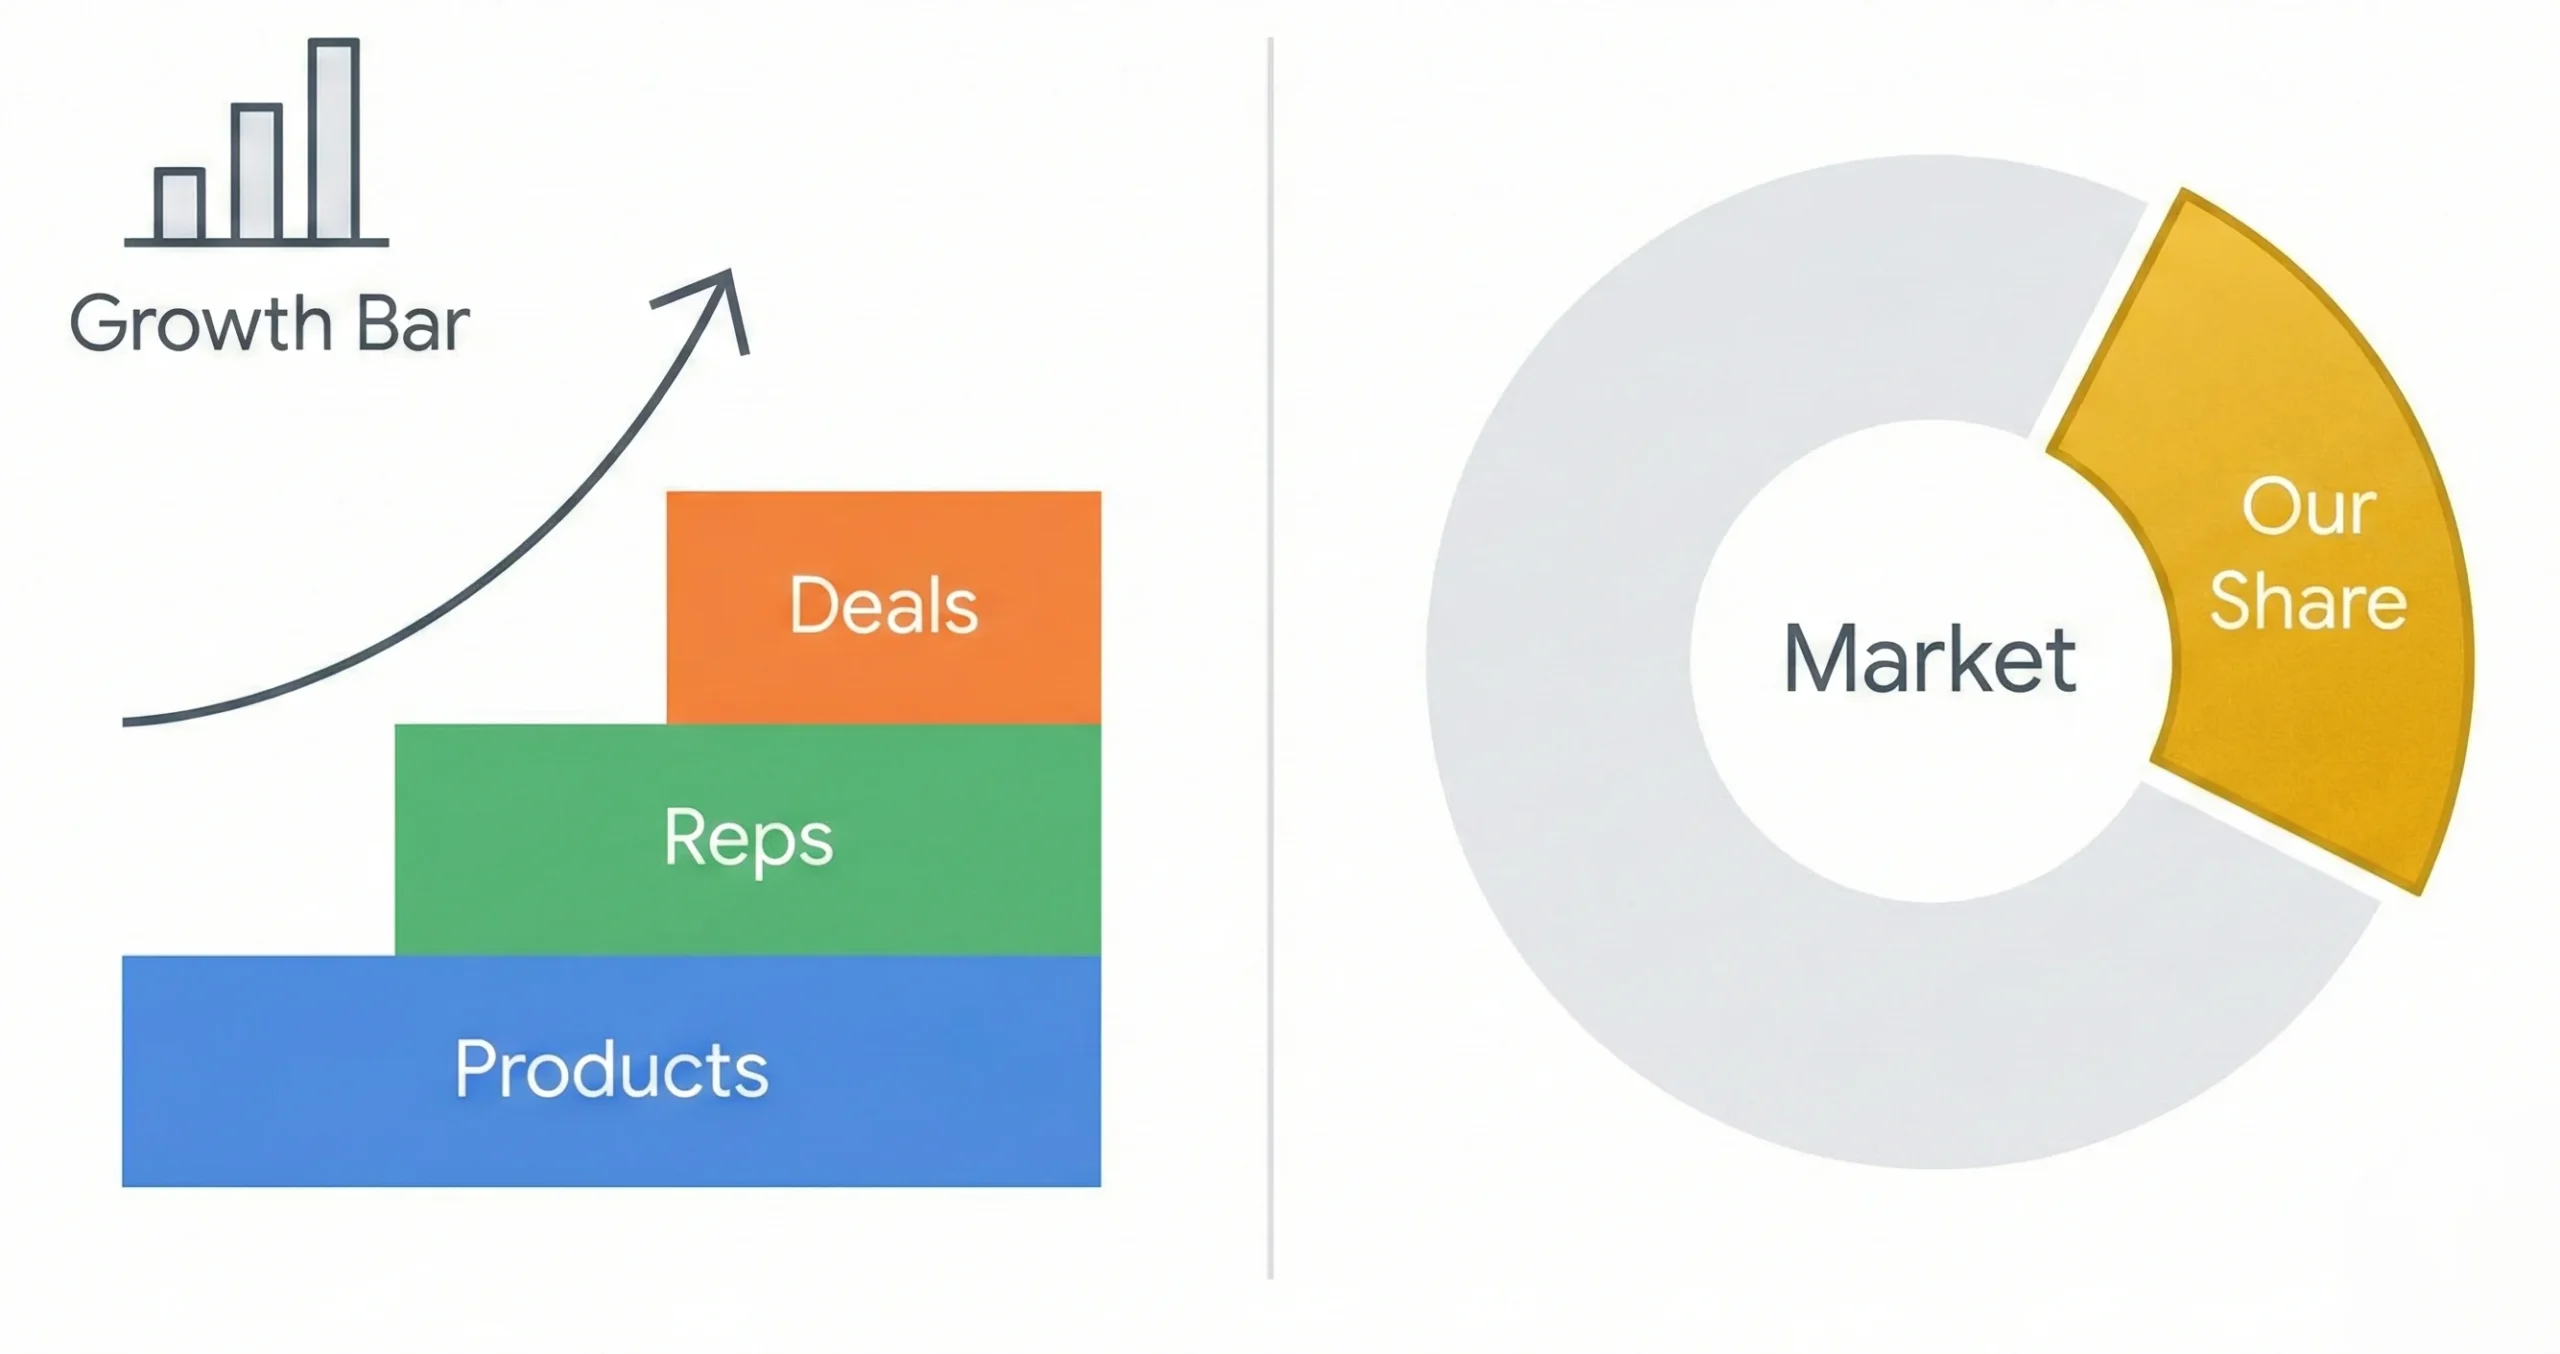
There are two broad ways to think about sales forecasts: bottom-up and top-down. Both approaches try to answer the same question—how much will we sell—but they start from different information and perspectives.
Bottom-up forecasting starts from detailed, internal data about deals, customers, and products, and then aggregates that information to create an overall forecast. Top-down forecasting, in contrast, starts from the estimated size of the market and the share the company expects to capture, then converts that into revenue expectations.
Many companies use a hybrid approach, combining bottom-up detail with top-down market context to reduce blind spots and validate assumptions. The choice of emphasis often depends on data availability, company maturity, and how volatile the external market is.
Bottom-up forecasting
Bottom-up forecasting builds the forecast from the “ground level” by analyzing internal sales data, such as win rates, deal sizes, sales cycles, and current opportunities in the pipeline. For example, a company might look at each salesperson’s open opportunities, apply historical close rates by stage, and sum the expected values to project future sales.
This approach is well-suited to organizations with established sales processes and reliable data, because it leverages specific information about how the business actually performs. It is also easier to adjust when something changes internally, such as hiring more reps or changing pricing, because the model is built from granular units that can be modified.
However, bottom-up forecasting can be time-consuming and is heavily dependent on data quality and sales discipline, such as consistently updating CRM records. If the underlying data is incomplete or inaccurate, the resulting forecast will also be unreliable, regardless of how detailed it appears.
Bottom-up summary:
- Starts from detailed internal data and aggregates upward.
- Very useful when data quality and CRM discipline are strong.
- Can be more accurate but requires effort and clean datasets.
Top-down forecasting
Top-down forecasting begins by estimating the total addressable market (TAM) or overall market size for a product or service, then deciding what share of that market the company expects to win over a given period. The forecasted sales are calculated by multiplying the estimated market size by the expected market share.
This approach is particularly useful for new products or markets where historical internal data is limited, because it allows planners to anchor their expectations to industry-level information. It also gives leadership a high-level, strategic view of what is possible if the company executes a certain go-to-market plan successfully.
The limitation of top-down forecasting is that it can be overly optimistic or disconnected from operational realities if the assumed market share is not grounded in actual capabilities and competition. Because of that, many practitioners recommend validating top-down projections with bottom-up views where possible.
Top-down summary:
- Starts from market size and assumed market share.
- Helpful when historical internal data is thin or business is new.
- Needs careful calibration to avoid unrealistic assumptions.
Hybrid approach
A hybrid approach combines top-down and bottom-up forecasts to create a more robust estimate that incorporates both market potential and internal execution patterns. For example, leadership may start with a top-down target based on market growth and strategic ambitions, then compare it with a bottom-up forecast based on pipeline and historical performance.
When the two perspectives diverge significantly, the gap can spark useful discussions about assumptions in either direction—such as whether sales capacity is sufficient to hit a top-down goal, or whether internal expectations are too conservative relative to market growth. This interplay often leads to more realistic plans and clearer requirements for marketing and sales investments.
Hybrid summary:
- Uses both approaches to cross-check and refine forecasts.
- Highlights gaps between ambition (top-down) and capacity (bottom-up).
- Often the most practical approach in growing organizations.
Sales Forecasting Methods and Techniques
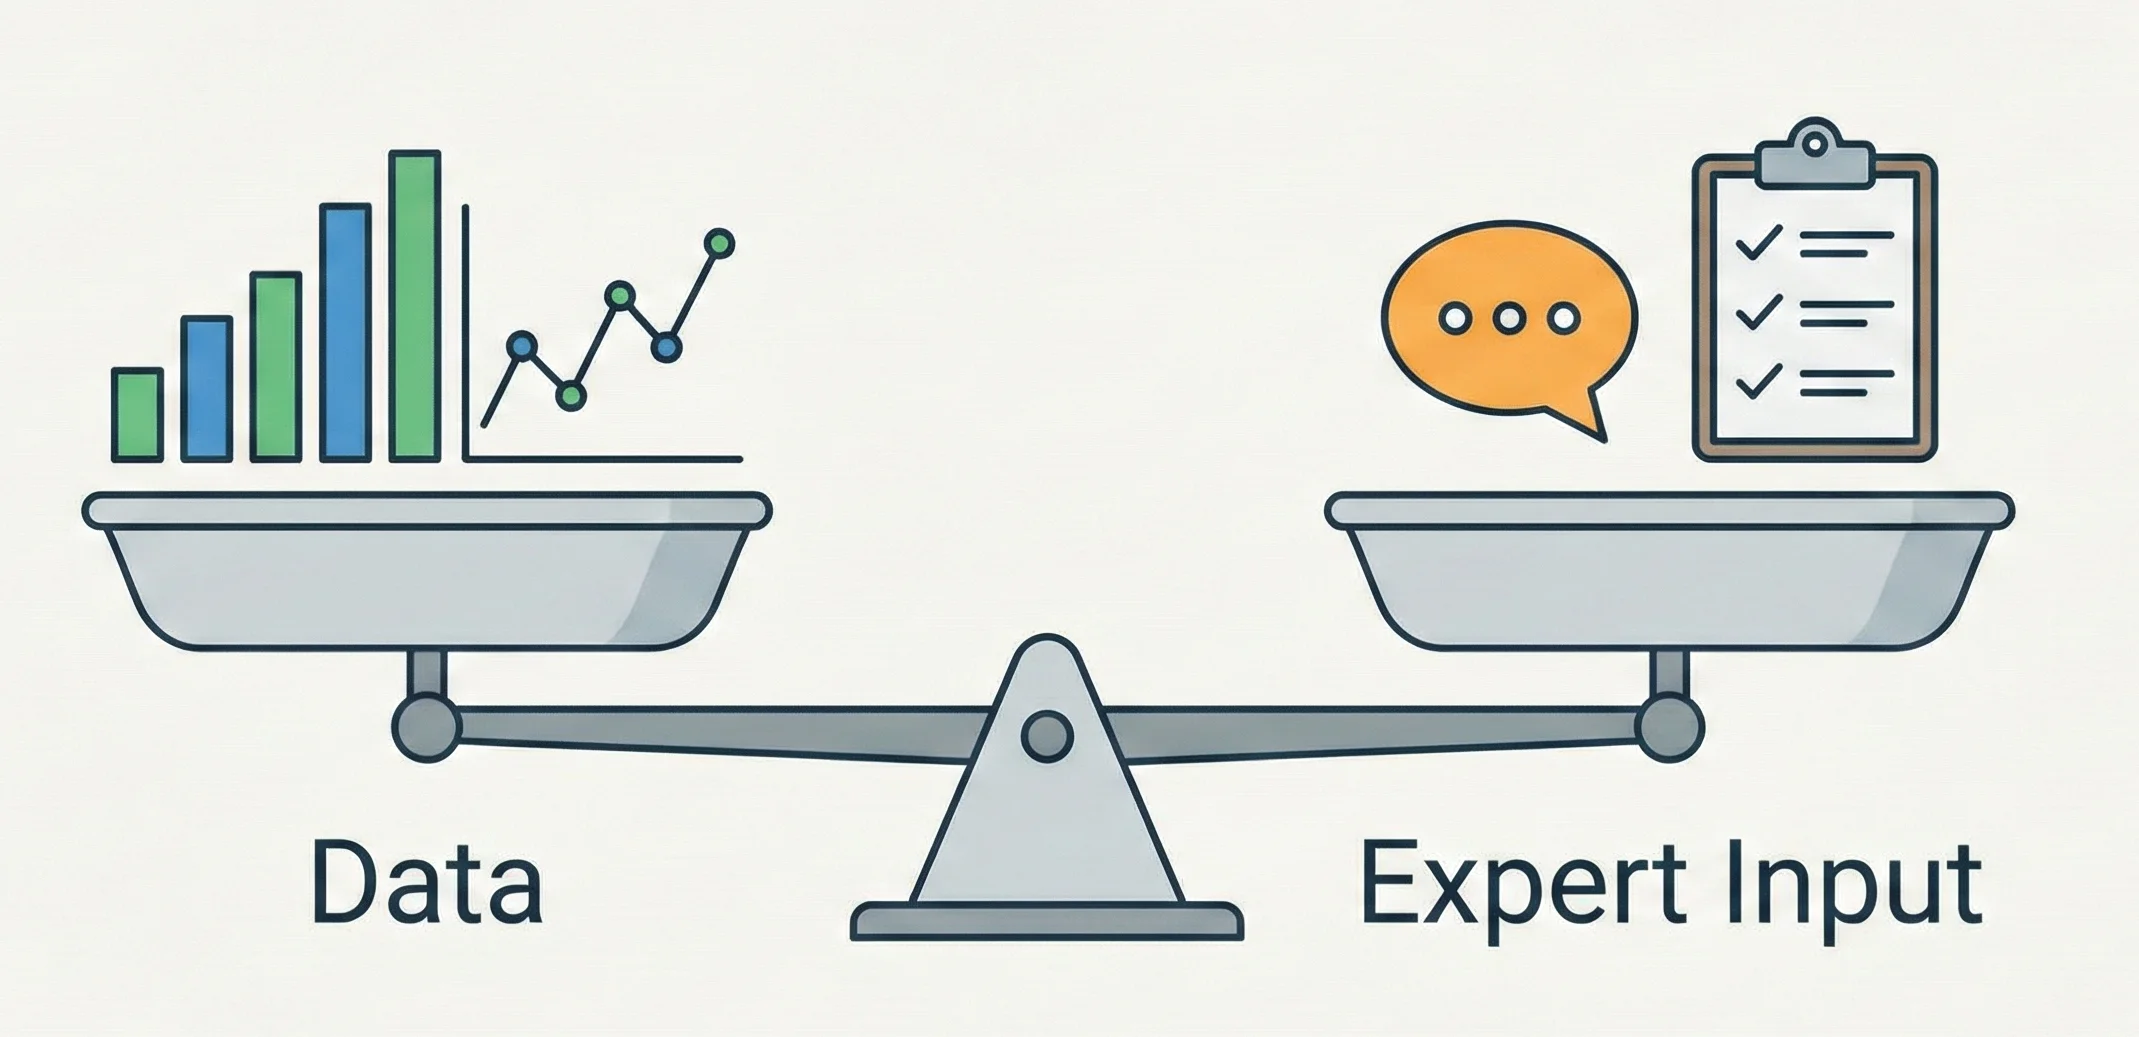
Sales forecasting uses a mix of quantitative and qualitative methods, chosen based on data availability, business model, and the level of precision needed. In practice, many organizations combine several methods to cross-check results and cover different aspects of their sales cycle.
Quantitative methods (data-driven)
Quantitative methods rely on historical numerical data and statistical techniques to project future sales. One common approach is time series analysis, which examines trends, cycles, and seasonality in past sales data to extrapolate future values over similar periods.
Regression analysis is another technique, where sales are modeled as a function of variables such as price, marketing spend, or economic indicators to understand how changes in those inputs affect outcomes. Simpler methods include using historical averages or moving averages, which smooth short-term fluctuations and reveal longer-term directional patterns.
More advanced quantitative methods may use multivariable models that incorporate multiple drivers at once, such as channel mix, territory, and customer segment, to improve accuracy. In organizations with sufficient data, these techniques can be implemented in spreadsheets or embedded in analytics tools and forecasting platforms.
Key quantitative techniques:
- Time series analysis (trends and seasonality).
- Regression and multivariable models.
- Historical averages and moving averages.
Qualitative methods (expert-driven)
Qualitative methods rely on the judgment and experience of people close to the market, such as sales reps, managers, and subject-matter experts. A common example is sales rep forecasting, where individual reps estimate what they expect to close based on their current opportunities and customer conversations.
Another widely used qualitative approach is opportunity stage forecasting, which assigns probabilities to deals based on where they sit in the sales pipeline, adjusted by sales leadership to account for nuances not captured in the data. Organizations may also use structured expert opinion panels and market research to shape forecasts, especially when launching new products or entering unfamiliar markets.
Lead scoring and sales cycle length analyses often bridge qualitative and quantitative perspectives by using measured behaviors and historical durations, combined with expert interpretation. These methods are particularly helpful when hard data is limited but experienced people have strong knowledge of buyer behavior and industry dynamics.
Key qualitative techniques:
- Sales rep judgment and manager overrides.
- Opportunity-stage probability forecasting.
- Expert panels and market research inputs.
Advanced methods
Advanced methods use predictive analytics, machine learning, and scenario planning to refine forecasts beyond traditional techniques. Predictive models can ingest large amounts of structured and unstructured data—from CRM records to engagement signals—to identify patterns that humans might overlook.
Scenario planning is another advanced practice where teams build multiple forecasts under different assumptions, such as optimistic, conservative, and base-case scenarios, to understand a range of possible outcomes. Subscription and usage-based businesses may also use consumption-based forecasting, which predicts revenue based on how customers actually use the product over time.
These advanced methods require good data infrastructure and analytical capabilities, but they can significantly improve accuracy and responsiveness in dynamic markets. As tools continue to evolve, more organizations are incorporating such techniques into their standard planning cycles.
Advanced techniques overview:
- Machine learning and AI-driven models.
- Scenario planning (best/base/worst case).
- Usage/consumption-based forecasting in recurring revenue models.
Also Check: What Is Sales Management? Benefits, Process & Best Practices
How to Create an Accurate Sales Forecast: Step-by-Step Guide
Building an accurate sales forecast is less about a single formula and more about following a disciplined process that connects data, assumptions, and regular review. The steps below reflect common practices used in organizations that treat forecasting as a core management function rather than a one-off exercise.
Step 1: Gather and organize historical sales data
The starting point for most forecasts is a clean, structured set of historical sales data. Typically, this includes past revenue broken down by time period, product or service, customer segment, geography, and sales representative.
Organizations often store this information in CRM systems, billing platforms, and financial software, then centralize it for analysis. As part of this step, it is important to remove clear anomalies—such as one-time deals or data entry errors—or at least tag them so they do not distort trends.
Data to collect:
- Revenue by month/quarter/year.
- Revenue by product, segment, region, and rep.
- Deal size, win rate, and sales cycle length.
Step 2: Assess historical trends and patterns
Once data is organized, the next task is to identify trends, seasonality, and other patterns that explain how sales have behaved over time. This typically includes looking at growth rates, comparing performance across comparable periods (such as year-over-year quarters), and calculating average deal size and win rates.
Many teams calculate a run rate, which is the projected amount of sales per period if current trends continue unchanged. Observing patterns such as strong holiday seasons or slower summer months helps refine future expectations for similar periods.
Analysis actions:
- Detect growth or decline trends.
- Identify seasonal peaks and troughs.
- Compute run rate, average deal size, and win rates.
Step 3: Include business plans and initiatives
Historical data alone will not fully describe the future, because upcoming business plans can significantly change demand or capacity. This step involves layering in information about planned product launches, new markets, pricing changes, and marketing campaigns.
It also includes planned changes in sales headcount, such as hiring new reps or entering new territories, since these investments can expand the organization’s ability to capture demand. Ignoring such planned initiatives would make forecasts systematically conservative, while overestimating their impact can lead to overly optimistic projections.
What to factor in:
- Product launches and feature releases.
- New markets, channels, and customer segments.
- Sales hiring plans and territory expansion.
- Major marketing or pricing changes.
Step 4: Incorporate external market factors
Forecasts are affected not only by internal actions but also by external conditions like economic trends, industry cycles, and competitor behavior. During this step, teams consider indicators such as market growth rates, regulatory changes, and macroeconomic data that may influence customer spending.
Seasonal events and industry-specific cycles—such as budget refresh periods in B2B or holiday peaks in retail—also play an important role. Aligning assumptions with credible market research and industry benchmarks can help keep projections grounded in broader realities.
External factors to review:
- Industry growth and competitive landscape.
- Macroeconomic conditions and consumer confidence.
- Seasonal cycles and regulatory changes.
Step 5: Select your forecasting method
With data and context in place, a company chooses one or more methods that match its business model and available information. For example, a company with many years of stable sales data might emphasize quantitative time series techniques, while a startup with limited history might rely more on pipeline-based and qualitative methods.
The choice also depends on the desired forecast period and granularity; some organizations build monthly forecasts for operational planning and separate annual forecasts for strategic budgeting. Using multiple methods side by side can help identify where assumptions diverge and enable a more informed consensus.
Method selection checklist:
- Match method to data availability (rich vs. limited history).
- Match time horizon (short-term operational vs. long-term strategic).
- Consider combining two or more methods for cross-checking.
Step 6: Build and validate the forecast
At this stage, the team applies the chosen methods to produce numerical forecasts and then carefully examines whether the results make sense. Validation often involves comparing outputs from different models, checking that implied growth rates are realistic, and reviewing the forecast with stakeholders who understand the sales process closely.
Cross-functional reviews with sales, marketing, finance, and operations help surface overlooked factors or inconsistent assumptions. Adjustments are then made to reach a forecast that is both data-supported and broadly understood by the people responsible for delivering it.
Validation activities:
- Compare multiple model outputs (where available).
- Sense-check growth assumptions and capacity limits.
- Review with sales, marketing, finance, and operations.
Step 7: Monitor, review, and adjust
A forecast is not static; it needs to be tracked against actual results and refined over time. Organizations typically measure forecast accuracy by comparing predicted and actual revenues for each period and then analyzing any variance.
Regular reviews—often monthly or quarterly—allow teams to update assumptions based on new information, such as emerging economic shifts or unexpected campaign performance. Over time, this continuous feedback loop improves the quality of forecasting models and builds organizational discipline around data-driven planning.
Ongoing improvement:
- Track forecast vs. actual results each period.
- Analyze variance to understand root causes.
- Update models and assumptions regularly.
Common Sales Forecasting Tools and Software
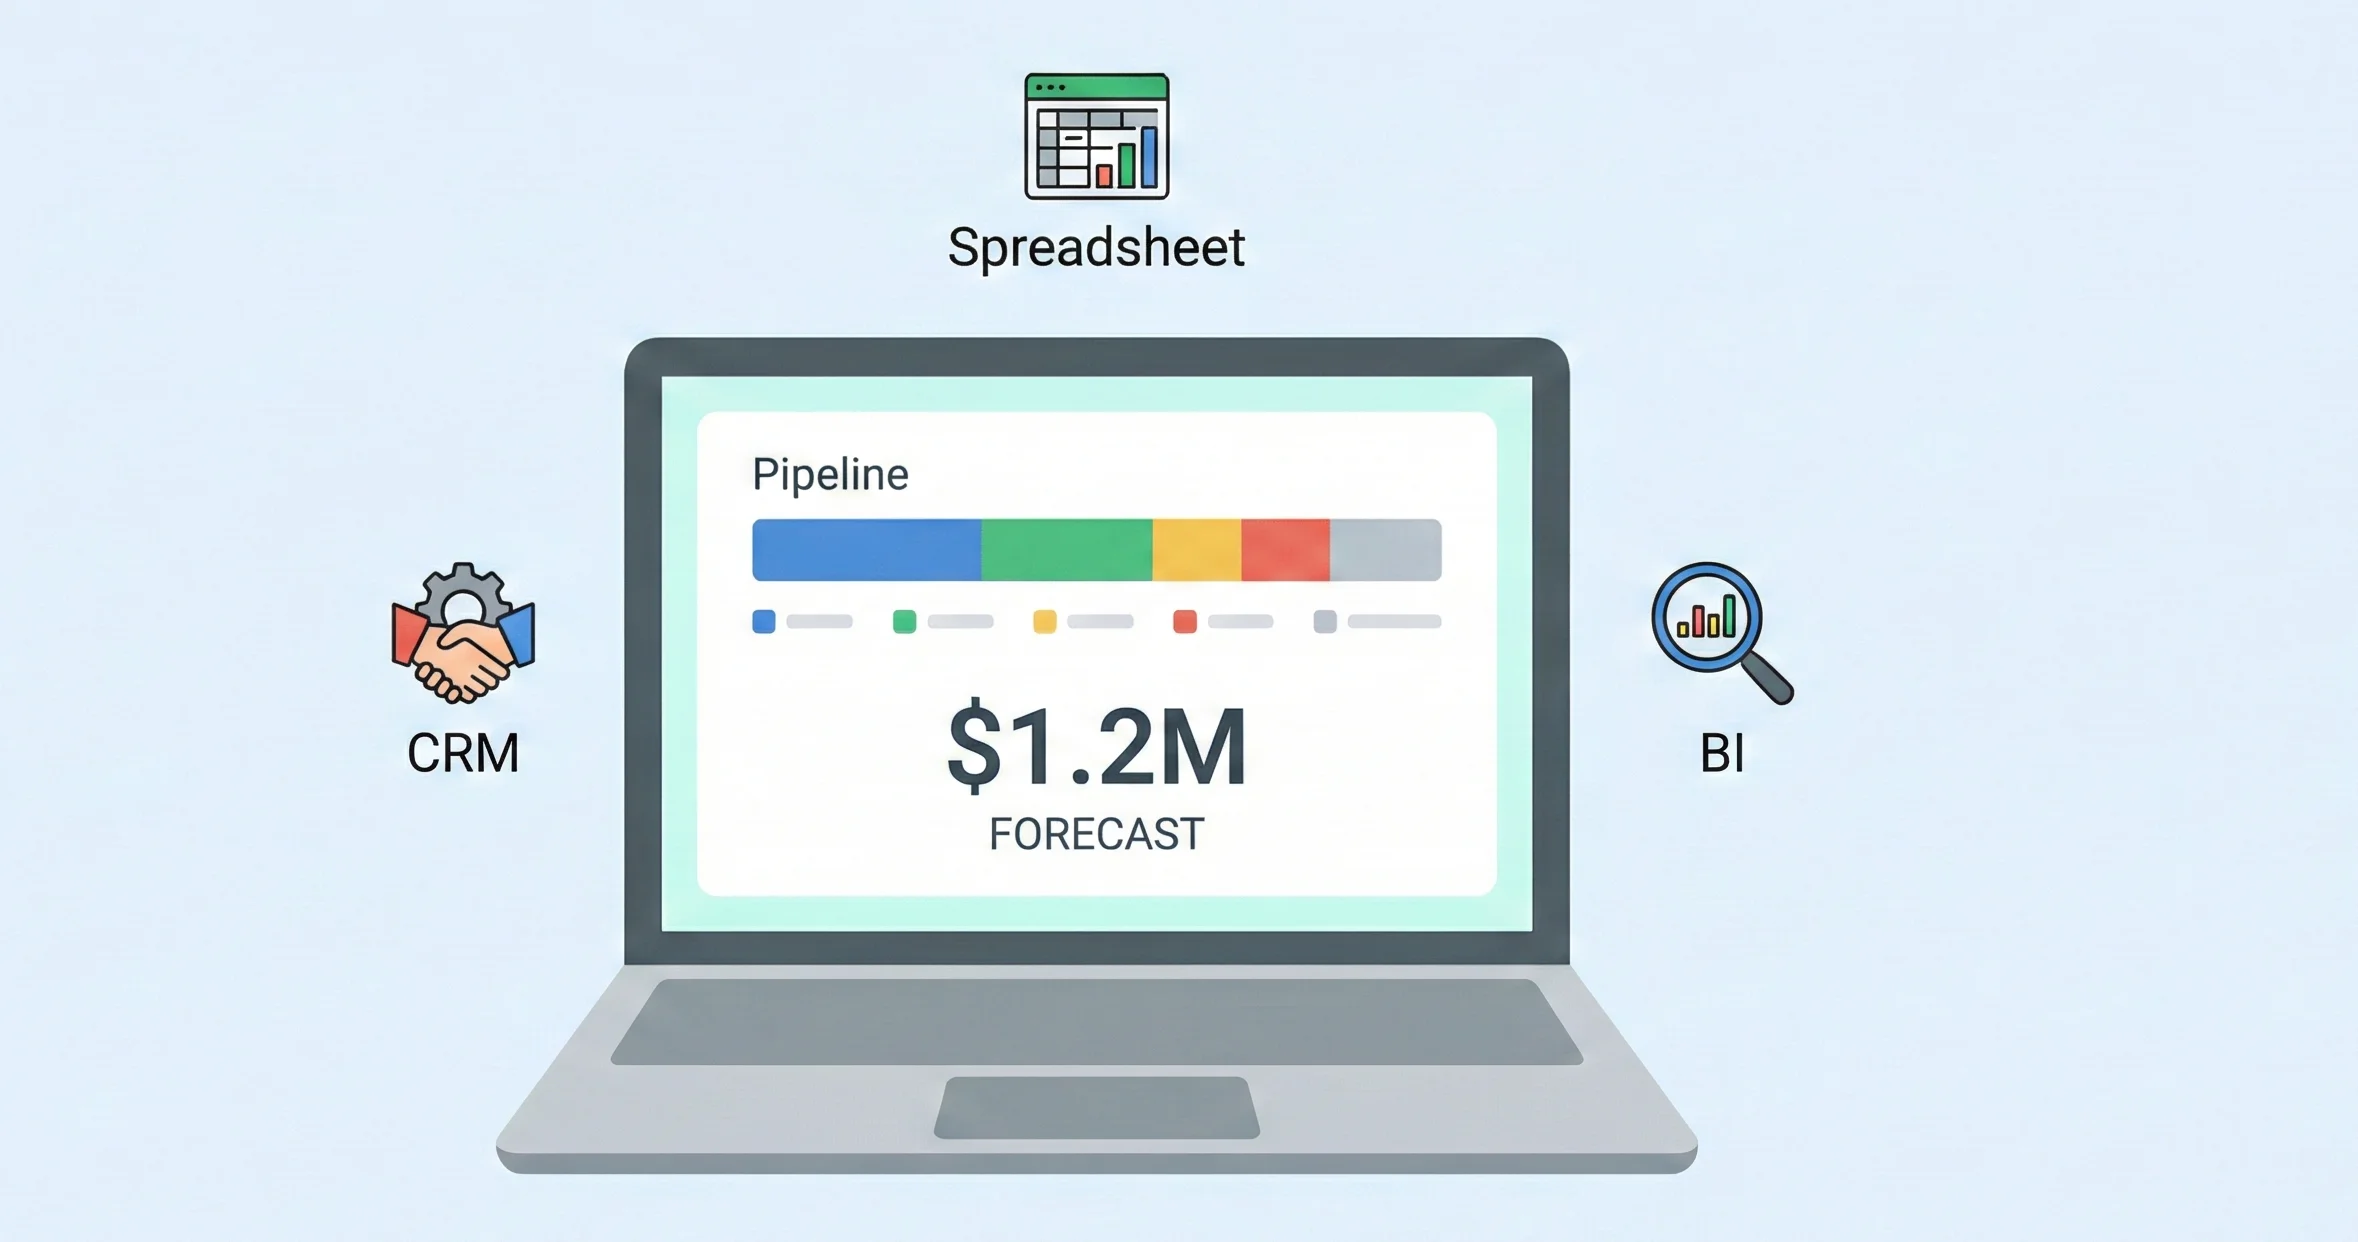
Modern sales forecasting is heavily supported by software tools that help capture data, run calculations, and present results in understandable formats. For most organizations, the core system is a customer relationship management (CRM) platform, often supplemented by analytics or planning tools.
CRM platforms such as Salesforce, HubSpot, and Pipedrive typically include built-in forecasting features that use pipeline data, deal stages, and historical win rates to estimate future sales. Because these systems already store customer and opportunity information, they can automatically generate updated forecasts as records change.
Beyond CRMs, specialized forecasting and planning tools offer more advanced modeling, scenario planning, and integration with broader financial data. Business intelligence tools are also widely used to visualize forecast data and explore patterns in greater depth.
For smaller organizations or those early in their forecasting journey, spreadsheets like Excel or Google Sheets remain common because of their flexibility and familiarity. However, as businesses grow and the volume of data increases, many find that moving to integrated tools improves accuracy and reduces manual errors.
Tool categories:
- CRM platforms with built-in forecasting.
- Dedicated planning/FP&A tools.
- BI dashboards and reporting tools.
- Spreadsheets for early-stage or lightweight forecasting.
Bottom-Up vs. Top-Down: Which Should You Use?
Choosing between bottom-up and top-down forecasting depends on company size, data availability, and strategic needs, and many organizations use both to balance detail and big-picture context. Each approach has advantages and trade-offs that should be understood before selecting a primary method.
Bottom-up forecasting is generally considered more grounded in operational reality, because it aggregates forecasts from individual reps, products, or regions. It is particularly well-suited to mature organizations with robust CRM usage and well-defined sales processes.
Top-down forecasting is useful when internal data is limited or when leadership wants to explore what might be achievable within a growing or changing market. This method gives a strategic view of opportunity but can be less precise at predicting exactly what the current organization will achieve without corresponding internal capacity.
Many practitioners recommend using a hybrid approach where top-down numbers set directional goals and bottom-up forecasts show what is realistically achievable based on existing pipeline and resources. The difference between the two then informs whether additional investment or strategy changes are needed.
When to use each:
- Bottom-up: strong internal data and stable processes.
- Top-down: new markets, high-level goal setting.
- Hybrid: align ambition with operational reality.
Common Sales Forecasting Mistakes to Avoid
Forecasts often fail not because of the underlying math, but because of recurring process and judgment errors. Being aware of common mistakes can help organizations build more reliable and actionable forecasts.
One frequent issue is using incomplete or poor-quality data, which leads to misleading results even when sophisticated techniques are applied. If CRM records are outdated or key activities are not tracked, the forecast will not accurately reflect reality.
Another common problem is ignoring seasonality and market cycles, resulting in forecasts that assume the same performance every month despite clear historical peaks and troughs. Over-reliance on optimistic assumptions, such as assuming unusually high close rates or rapid ramp-up of new initiatives, can also distort projections.
Organizations sometimes fail to adjust forecasts when significant internal or external changes occur, effectively treating them as static commitments instead of living estimates. Additionally, building forecasts in isolation—without input from sales, marketing, and finance—can create disconnects between expectations and what teams can realistically deliver.
Finally, some companies never measure forecast accuracy or investigate why forecasts were off, missing opportunities to learn and improve their process over time. Establishing a culture of reviewing and refining forecasts helps avoid repeating the same mistakes period after period.
Mistakes to watch for:
- Poor or incomplete data in CRM and systems.
- Ignoring seasonality and market cycles.
- Overly optimistic assumptions and no adjustments.
- Limited cross-functional input and no accuracy reviews.
Best Practices for Accurate Sales Forecasting
Accurate sales forecasting requires consistent processes, cross-functional collaboration, and a focus on data quality. Following established best practices can help organizations improve both the reliability of their forecasts and the business value they derive from them.
One widely recommended practice is to establish a regular forecasting cadence, such as monthly or quarterly, so that forecasts are updated quickly enough to reflect changing conditions. Involving multiple teams—particularly sales, marketing, finance, and operations—ensures that different perspectives and information sources are represented.
Maintaining data quality is essential, which means standardizing how sales stages, deal values, and close dates are recorded across the organization. Segmenting forecasts by region, product line, or customer segment can reveal patterns that would be hidden in a single aggregated number.
Investing in appropriate tools and training also helps teams use forecasting features effectively and understand why accurate data entry matters. Over time, comparing forecasted versus actual results and conducting variance analysis strengthens the forecasting discipline and sharpens assumptions.
Creating a culture that values realistic forecasting over inflated numbers is equally important, because overly optimistic forecasts can undermine trust and lead to poor decisions. Encouraging transparency and constructive discussion about risks and uncertainties leads to more robust and credible projections.
Best practice checklist:
- Set a regular forecasting cadence.
- Involve sales, marketing, finance, and operations.
- Standardize data definitions and stages.
- Segment forecasts for deeper insight.
- Track accuracy and refine assumptions continuously.
Sales Forecasting for Different Business Types
While the principles of sales forecasting are broadly similar, the way they are applied can differ significantly across business models such as B2B SaaS, retail, and B2C. Understanding these nuances helps tailor forecasting methods to each context.
In B2B SaaS businesses, forecasting often centers on subscription revenue, churn, and expansion, with a strong emphasis on pipeline stages and customer lifetime value. Metrics such as monthly recurring revenue (MRR) and annual recurring revenue (ARR) are key inputs into forecasts.
Retail and e-commerce companies typically rely heavily on seasonality and historical demand patterns, using detailed SKU-level data to plan inventory and promotions. Shorter sales cycles and large transaction volumes make quantitative time series models particularly useful.
B2C and other high-volume businesses often focus on lead or traffic volumes, conversion rates, and average order values to project sales. Startups or early-stage companies, regardless of sector, tend to lean more on qualitative and top-down methods initially because they have limited historical data, then gradually shift toward data-driven approaches as they grow.
By business type:
- B2B SaaS: focus on MRR, ARR, churn, and upsell.
- Retail/e-commerce: emphasis on seasonality and SKU-level trends.
- B2C/high-volume: traffic, conversion rates, and order values.
- Startups: more qualitative/top-down early, more quantitative later.
Sales Forecasting and Revenue Impact
Accurate sales forecasting has direct and measurable impacts on a company’s financial performance and strategic resilience. At the most basic level, it helps align spending with expected revenue, reducing the risk of cash flow shortages or underinvestment in growth.
When forecasts closely match reality, organizations can optimize inventory levels, staffing, and marketing investments, improving profitability and return on capital. Conversely, persistent forecasting errors—especially overestimation—can lead to excess costs, missed earnings expectations, and reduced stakeholder confidence.
From a strategic standpoint, robust forecasting enables leadership to test different growth scenarios and understand what would be required to achieve them, such as specific customer acquisition targets or new market entries. Over time, consistent forecasting practices contribute to a more reliable planning environment, making it easier to commit to longer-term investments.
Revenue impact highlights:
- Aligns costs and investments with realistic revenue expectations.
- Reduces waste from overstaffing or overstocking.
- Supports long-term strategic planning and scenario testing.
Conclusion
Sales forecasting is a structured, data-informed process for predicting future sales and revenue, and it sits at the center of sound budgeting, resource planning, and strategic decision-making. By combining historical data, current pipeline information, and external market context, organizations can move from reactive decision-making to proactive planning.
Implementing a disciplined forecasting process involves selecting appropriate methods, investing in tools, involving cross-functional teams, and continuously monitoring and improving forecast accuracy. Over time, companies that treat forecasting as a core capability gain a competitive advantage through more efficient operations, better risk management, and more confident growth strategies.

Passionate about blogging and focused on elevating brand visibility through strategic SEO and digital marketing. Always tuned in to the latest trends, I’m dedicated to maximizing engagement and delivering measurable ROI in the dynamic world of digital marketing. Let’s connect and unlock new opportunities together!